Immigrants from Uganda vs Immigrants from Liberia Child Poverty Under the Age of 5
COMPARE
Immigrants from Uganda
Immigrants from Liberia
Child Poverty Under the Age of 5
Child Poverty Under the Age of 5 Comparison
Immigrants from Uganda
Immigrants from Liberia
17.7%
CHILD POVERTY UNDER THE AGE OF 5
25.0/ 100
METRIC RATING
193rd/ 347
METRIC RANK
20.2%
CHILD POVERTY UNDER THE AGE OF 5
0.1/ 100
METRIC RATING
264th/ 347
METRIC RANK
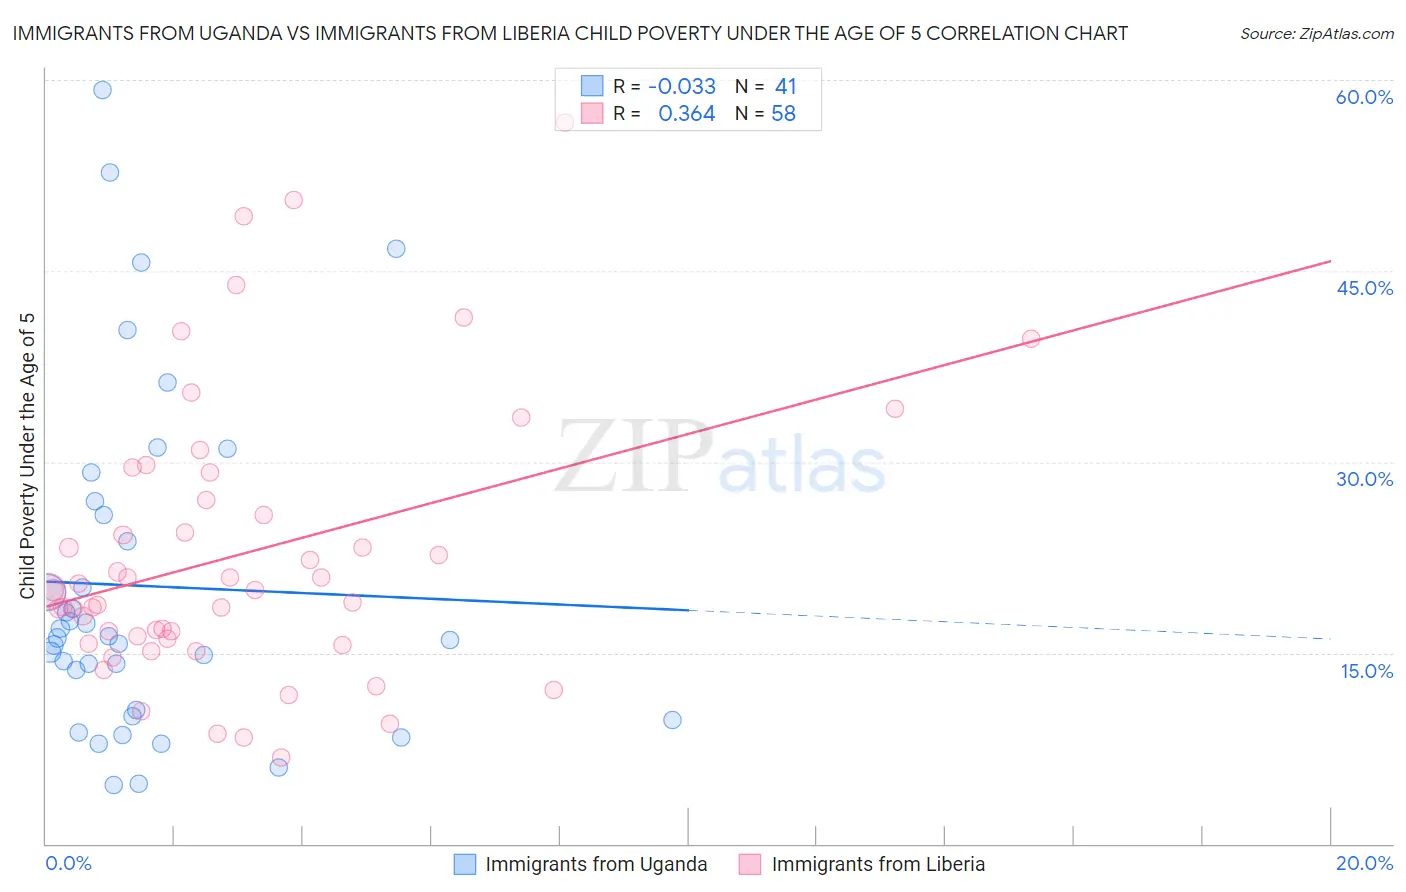
Immigrants from Uganda vs Immigrants from Liberia Child Poverty Under the Age of 5 Correlation Chart
The statistical analysis conducted on geographies consisting of 124,022,230 people shows no correlation between the proportion of Immigrants from Uganda and poverty level among children under the age of 5 in the United States with a correlation coefficient (R) of -0.033 and weighted average of 17.7%. Similarly, the statistical analysis conducted on geographies consisting of 133,700,788 people shows a mild positive correlation between the proportion of Immigrants from Liberia and poverty level among children under the age of 5 in the United States with a correlation coefficient (R) of 0.364 and weighted average of 20.2%, a difference of 14.0%.
Child Poverty Under the Age of 5 Correlation Summary
| Measurement | Immigrants from Uganda | Immigrants from Liberia |
| Minimum | 4.6% | 6.7% |
| Maximum | 59.2% | 56.7% |
| Range | 54.6% | 50.0% |
| Mean | 20.2% | 22.7% |
| Median | 16.2% | 19.9% |
| Interquartile 25% (IQ1) | 10.2% | 16.1% |
| Interquartile 75% (IQ3) | 26.4% | 27.0% |
| Interquartile Range (IQR) | 16.1% | 11.0% |
| Standard Deviation (Sample) | 13.3% | 10.9% |
| Standard Deviation (Population) | 13.1% | 10.8% |
Similar Demographics by Child Poverty Under the Age of 5
Demographics Similar to Immigrants from Uganda by Child Poverty Under the Age of 5
In terms of child poverty under the age of 5, the demographic groups most similar to Immigrants from Uganda are French Canadian (17.7%, a difference of 0.060%), Sierra Leonean (17.7%, a difference of 0.12%), Immigrants from Afghanistan (17.7%, a difference of 0.37%), Immigrants from Uruguay (17.7%, a difference of 0.37%), and Immigrants from Portugal (17.8%, a difference of 0.39%).
| Demographics | Rating | Rank | Child Poverty Under the Age of 5 |
| Immigrants | Bosnia and Herzegovina | 35.0 /100 | #186 | Fair 17.5% |
| Kenyans | 34.7 /100 | #187 | Fair 17.5% |
| Carpatho Rusyns | 33.6 /100 | #188 | Fair 17.5% |
| French | 33.6 /100 | #189 | Fair 17.5% |
| Slovaks | 29.2 /100 | #190 | Fair 17.6% |
| Immigrants | Afghanistan | 27.9 /100 | #191 | Fair 17.7% |
| Immigrants | Uruguay | 27.8 /100 | #192 | Fair 17.7% |
| Immigrants | Uganda | 25.0 /100 | #193 | Fair 17.7% |
| French Canadians | 24.6 /100 | #194 | Fair 17.7% |
| Sierra Leoneans | 24.1 /100 | #195 | Fair 17.7% |
| Immigrants | Portugal | 22.2 /100 | #196 | Fair 17.8% |
| Immigrants | Kenya | 20.0 /100 | #197 | Fair 17.9% |
| Celtics | 18.3 /100 | #198 | Poor 17.9% |
| Hungarians | 18.3 /100 | #199 | Poor 17.9% |
| Iraqis | 14.0 /100 | #200 | Poor 18.0% |
Demographics Similar to Immigrants from Liberia by Child Poverty Under the Age of 5
In terms of child poverty under the age of 5, the demographic groups most similar to Immigrants from Liberia are Barbadian (20.2%, a difference of 0.12%), Spanish American Indian (20.2%, a difference of 0.12%), Liberian (20.2%, a difference of 0.19%), Aleut (20.3%, a difference of 0.24%), and Immigrants from Bangladesh (20.1%, a difference of 0.60%).
| Demographics | Rating | Rank | Child Poverty Under the Age of 5 |
| Shoshone | 0.2 /100 | #257 | Tragic 20.0% |
| Immigrants | St. Vincent and the Grenadines | 0.2 /100 | #258 | Tragic 20.0% |
| Immigrants | El Salvador | 0.2 /100 | #259 | Tragic 20.0% |
| Spanish Americans | 0.2 /100 | #260 | Tragic 20.1% |
| Immigrants | Bangladesh | 0.2 /100 | #261 | Tragic 20.1% |
| Liberians | 0.1 /100 | #262 | Tragic 20.2% |
| Barbadians | 0.1 /100 | #263 | Tragic 20.2% |
| Immigrants | Liberia | 0.1 /100 | #264 | Tragic 20.2% |
| Spanish American Indians | 0.1 /100 | #265 | Tragic 20.2% |
| Aleuts | 0.1 /100 | #266 | Tragic 20.3% |
| Ottawa | 0.1 /100 | #267 | Tragic 20.3% |
| Belizeans | 0.1 /100 | #268 | Tragic 20.3% |
| Immigrants | Burma/Myanmar | 0.1 /100 | #269 | Tragic 20.4% |
| Jamaicans | 0.1 /100 | #270 | Tragic 20.4% |
| Americans | 0.1 /100 | #271 | Tragic 20.5% |