Immigrants from Uganda vs Salvadoran Child Poverty Under the Age of 5
COMPARE
Immigrants from Uganda
Salvadoran
Child Poverty Under the Age of 5
Child Poverty Under the Age of 5 Comparison
Immigrants from Uganda
Salvadorans
17.7%
CHILD POVERTY UNDER THE AGE OF 5
25.0/ 100
METRIC RATING
193rd/ 347
METRIC RANK
19.5%
CHILD POVERTY UNDER THE AGE OF 5
0.6/ 100
METRIC RATING
238th/ 347
METRIC RANK
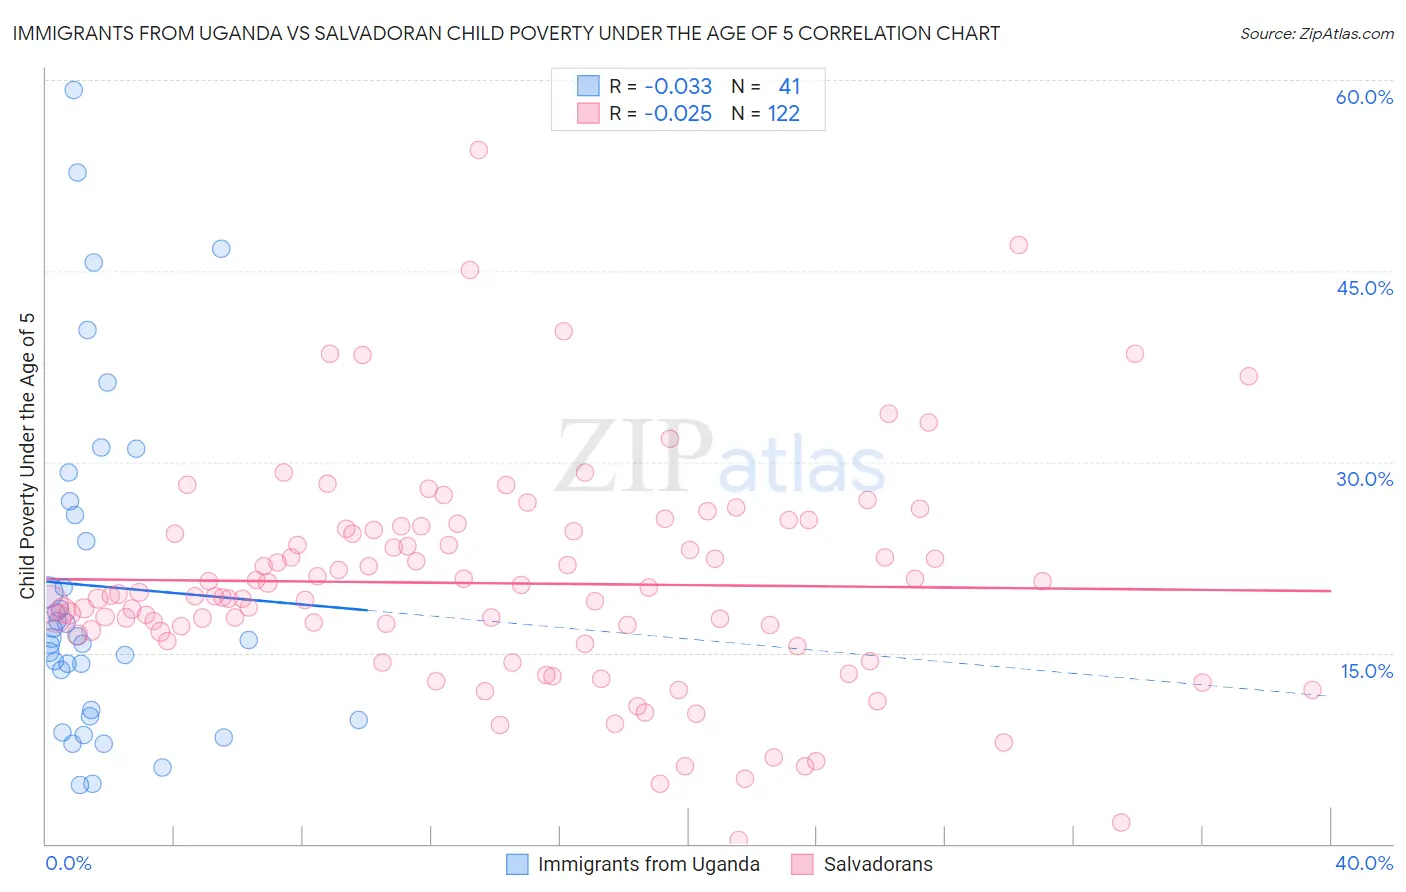
Immigrants from Uganda vs Salvadoran Child Poverty Under the Age of 5 Correlation Chart
The statistical analysis conducted on geographies consisting of 124,022,230 people shows no correlation between the proportion of Immigrants from Uganda and poverty level among children under the age of 5 in the United States with a correlation coefficient (R) of -0.033 and weighted average of 17.7%. Similarly, the statistical analysis conducted on geographies consisting of 386,669,991 people shows no correlation between the proportion of Salvadorans and poverty level among children under the age of 5 in the United States with a correlation coefficient (R) of -0.025 and weighted average of 19.5%, a difference of 10.1%.
Child Poverty Under the Age of 5 Correlation Summary
| Measurement | Immigrants from Uganda | Salvadoran |
| Minimum | 4.6% | 0.31% |
| Maximum | 59.2% | 54.5% |
| Range | 54.6% | 54.2% |
| Mean | 20.2% | 20.5% |
| Median | 16.2% | 19.5% |
| Interquartile 25% (IQ1) | 10.2% | 16.4% |
| Interquartile 75% (IQ3) | 26.4% | 24.6% |
| Interquartile Range (IQR) | 16.1% | 8.2% |
| Standard Deviation (Sample) | 13.3% | 8.7% |
| Standard Deviation (Population) | 13.1% | 8.7% |
Similar Demographics by Child Poverty Under the Age of 5
Demographics Similar to Immigrants from Uganda by Child Poverty Under the Age of 5
In terms of child poverty under the age of 5, the demographic groups most similar to Immigrants from Uganda are French Canadian (17.7%, a difference of 0.060%), Sierra Leonean (17.7%, a difference of 0.12%), Immigrants from Afghanistan (17.7%, a difference of 0.37%), Immigrants from Uruguay (17.7%, a difference of 0.37%), and Immigrants from Portugal (17.8%, a difference of 0.39%).
| Demographics | Rating | Rank | Child Poverty Under the Age of 5 |
| Immigrants | Bosnia and Herzegovina | 35.0 /100 | #186 | Fair 17.5% |
| Kenyans | 34.7 /100 | #187 | Fair 17.5% |
| Carpatho Rusyns | 33.6 /100 | #188 | Fair 17.5% |
| French | 33.6 /100 | #189 | Fair 17.5% |
| Slovaks | 29.2 /100 | #190 | Fair 17.6% |
| Immigrants | Afghanistan | 27.9 /100 | #191 | Fair 17.7% |
| Immigrants | Uruguay | 27.8 /100 | #192 | Fair 17.7% |
| Immigrants | Uganda | 25.0 /100 | #193 | Fair 17.7% |
| French Canadians | 24.6 /100 | #194 | Fair 17.7% |
| Sierra Leoneans | 24.1 /100 | #195 | Fair 17.7% |
| Immigrants | Portugal | 22.2 /100 | #196 | Fair 17.8% |
| Immigrants | Kenya | 20.0 /100 | #197 | Fair 17.9% |
| Celtics | 18.3 /100 | #198 | Poor 17.9% |
| Hungarians | 18.3 /100 | #199 | Poor 17.9% |
| Iraqis | 14.0 /100 | #200 | Poor 18.0% |
Demographics Similar to Salvadorans by Child Poverty Under the Age of 5
In terms of child poverty under the age of 5, the demographic groups most similar to Salvadorans are Immigrants from Cabo Verde (19.5%, a difference of 0.010%), Vietnamese (19.5%, a difference of 0.020%), Immigrants from Ecuador (19.6%, a difference of 0.40%), Alaska Native (19.6%, a difference of 0.46%), and Immigrants from Laos (19.4%, a difference of 0.57%).
| Demographics | Rating | Rank | Child Poverty Under the Age of 5 |
| Bermudans | 1.2 /100 | #231 | Tragic 19.2% |
| Trinidadians and Tobagonians | 0.9 /100 | #232 | Tragic 19.3% |
| Sudanese | 0.9 /100 | #233 | Tragic 19.3% |
| Immigrants | Micronesia | 0.9 /100 | #234 | Tragic 19.4% |
| Immigrants | Laos | 0.8 /100 | #235 | Tragic 19.4% |
| Immigrants | Trinidad and Tobago | 0.8 /100 | #236 | Tragic 19.4% |
| Immigrants | Cabo Verde | 0.6 /100 | #237 | Tragic 19.5% |
| Salvadorans | 0.6 /100 | #238 | Tragic 19.5% |
| Vietnamese | 0.6 /100 | #239 | Tragic 19.5% |
| Immigrants | Ecuador | 0.5 /100 | #240 | Tragic 19.6% |
| Alaska Natives | 0.5 /100 | #241 | Tragic 19.6% |
| Immigrants | Guyana | 0.5 /100 | #242 | Tragic 19.6% |
| Osage | 0.5 /100 | #243 | Tragic 19.6% |
| Immigrants | Ghana | 0.5 /100 | #244 | Tragic 19.6% |
| Immigrants | Western Africa | 0.4 /100 | #245 | Tragic 19.7% |