Immigrants from Uganda vs Immigrants from Thailand Child Poverty Under the Age of 5
COMPARE
Immigrants from Uganda
Immigrants from Thailand
Child Poverty Under the Age of 5
Child Poverty Under the Age of 5 Comparison
Immigrants from Uganda
Immigrants from Thailand
17.7%
CHILD POVERTY UNDER THE AGE OF 5
25.0/ 100
METRIC RATING
193rd/ 347
METRIC RANK
18.3%
CHILD POVERTY UNDER THE AGE OF 5
8.6/ 100
METRIC RATING
213th/ 347
METRIC RANK
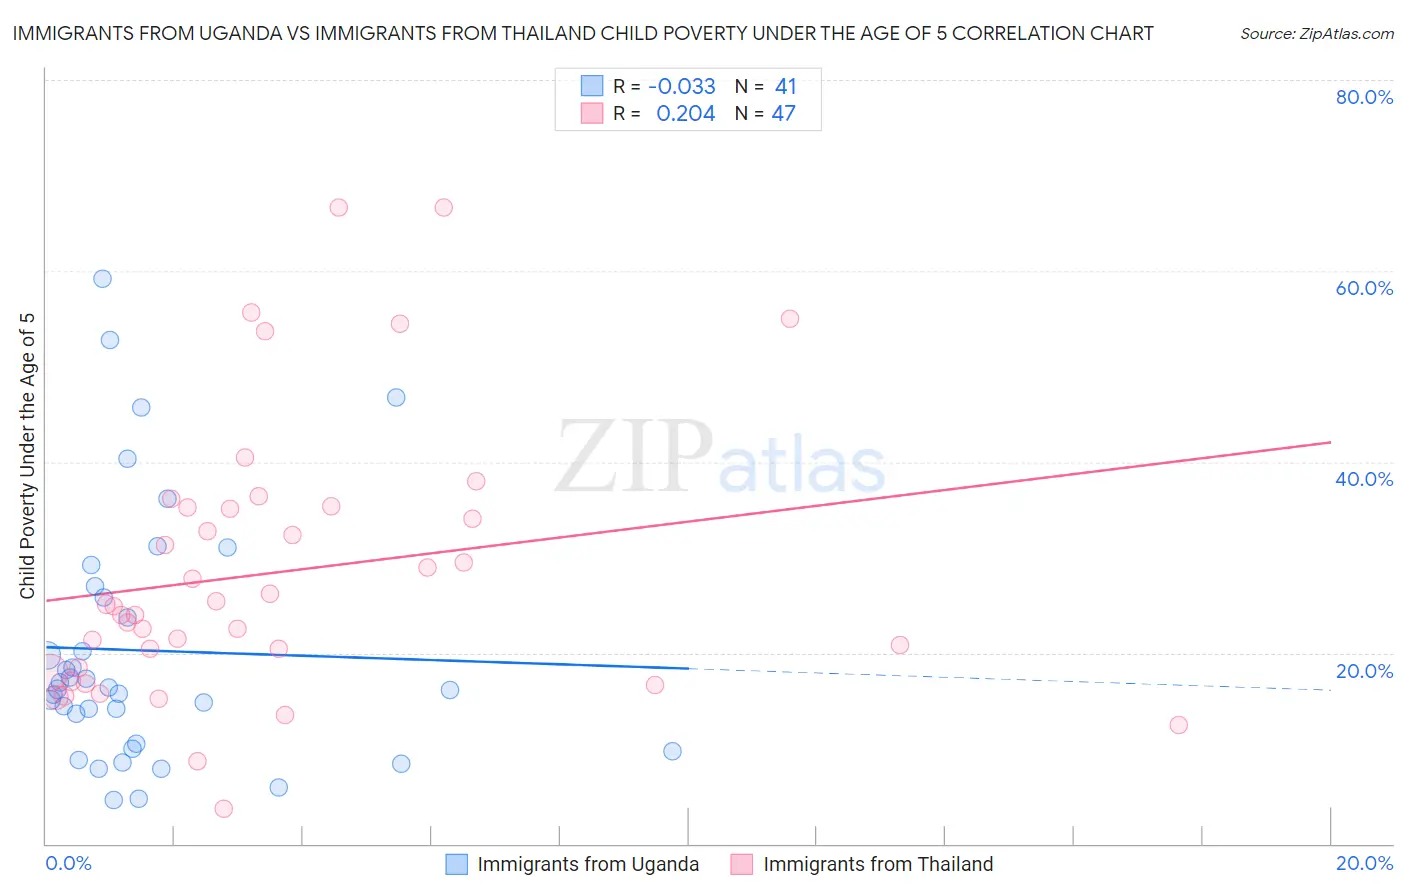
Immigrants from Uganda vs Immigrants from Thailand Child Poverty Under the Age of 5 Correlation Chart
The statistical analysis conducted on geographies consisting of 124,022,230 people shows no correlation between the proportion of Immigrants from Uganda and poverty level among children under the age of 5 in the United States with a correlation coefficient (R) of -0.033 and weighted average of 17.7%. Similarly, the statistical analysis conducted on geographies consisting of 307,963,504 people shows a weak positive correlation between the proportion of Immigrants from Thailand and poverty level among children under the age of 5 in the United States with a correlation coefficient (R) of 0.204 and weighted average of 18.3%, a difference of 3.2%.
Child Poverty Under the Age of 5 Correlation Summary
| Measurement | Immigrants from Uganda | Immigrants from Thailand |
| Minimum | 4.6% | 3.7% |
| Maximum | 59.2% | 66.7% |
| Range | 54.6% | 63.0% |
| Mean | 20.2% | 28.4% |
| Median | 16.2% | 24.9% |
| Interquartile 25% (IQ1) | 10.2% | 18.0% |
| Interquartile 75% (IQ3) | 26.4% | 35.3% |
| Interquartile Range (IQR) | 16.1% | 17.3% |
| Standard Deviation (Sample) | 13.3% | 14.4% |
| Standard Deviation (Population) | 13.1% | 14.2% |
Demographics Similar to Immigrants from Uganda and Immigrants from Thailand by Child Poverty Under the Age of 5
In terms of child poverty under the age of 5, the demographic groups most similar to Immigrants from Uganda are French Canadian (17.7%, a difference of 0.060%), Sierra Leonean (17.7%, a difference of 0.12%), Immigrants from Portugal (17.8%, a difference of 0.39%), Immigrants from Kenya (17.9%, a difference of 0.72%), and Celtic (17.9%, a difference of 1.0%). Similarly, the demographic groups most similar to Immigrants from Thailand are Nepalese (18.3%, a difference of 0.020%), Moroccan (18.2%, a difference of 0.23%), Panamanian (18.2%, a difference of 0.32%), Spanish (18.2%, a difference of 0.33%), and Scotch-Irish (18.2%, a difference of 0.34%).
| Demographics | Rating | Rank | Child Poverty Under the Age of 5 |
| Immigrants | Uganda | 25.0 /100 | #193 | Fair 17.7% |
| French Canadians | 24.6 /100 | #194 | Fair 17.7% |
| Sierra Leoneans | 24.1 /100 | #195 | Fair 17.7% |
| Immigrants | Portugal | 22.2 /100 | #196 | Fair 17.8% |
| Immigrants | Kenya | 20.0 /100 | #197 | Fair 17.9% |
| Celtics | 18.3 /100 | #198 | Poor 17.9% |
| Hungarians | 18.3 /100 | #199 | Poor 17.9% |
| Iraqis | 14.0 /100 | #200 | Poor 18.0% |
| Ugandans | 13.9 /100 | #201 | Poor 18.0% |
| Japanese | 13.8 /100 | #202 | Poor 18.1% |
| Immigrants | Cambodia | 13.7 /100 | #203 | Poor 18.1% |
| Immigrants | Eastern Africa | 13.4 /100 | #204 | Poor 18.1% |
| Spaniards | 12.8 /100 | #205 | Poor 18.1% |
| Whites/Caucasians | 12.6 /100 | #206 | Poor 18.1% |
| Immigrants | Immigrants | 9.9 /100 | #207 | Tragic 18.2% |
| Scotch-Irish | 9.8 /100 | #208 | Tragic 18.2% |
| Spanish | 9.8 /100 | #209 | Tragic 18.2% |
| Panamanians | 9.7 /100 | #210 | Tragic 18.2% |
| Moroccans | 9.4 /100 | #211 | Tragic 18.2% |
| Nepalese | 8.7 /100 | #212 | Tragic 18.3% |
| Immigrants | Thailand | 8.6 /100 | #213 | Tragic 18.3% |