Immigrants from Uganda vs Immigrants from Austria Female Poverty Among 18-24 Year Olds
COMPARE
Immigrants from Uganda
Immigrants from Austria
Female Poverty Among 18-24 Year Olds
Female Poverty Among 18-24 Year Olds Comparison
Immigrants from Uganda
Immigrants from Austria
20.8%
FEMALE POVERTY AMONG 18-24 YEAR OLDS
5.1/ 100
METRIC RATING
235th/ 347
METRIC RANK
19.7%
FEMALE POVERTY AMONG 18-24 YEAR OLDS
83.1/ 100
METRIC RATING
147th/ 347
METRIC RANK
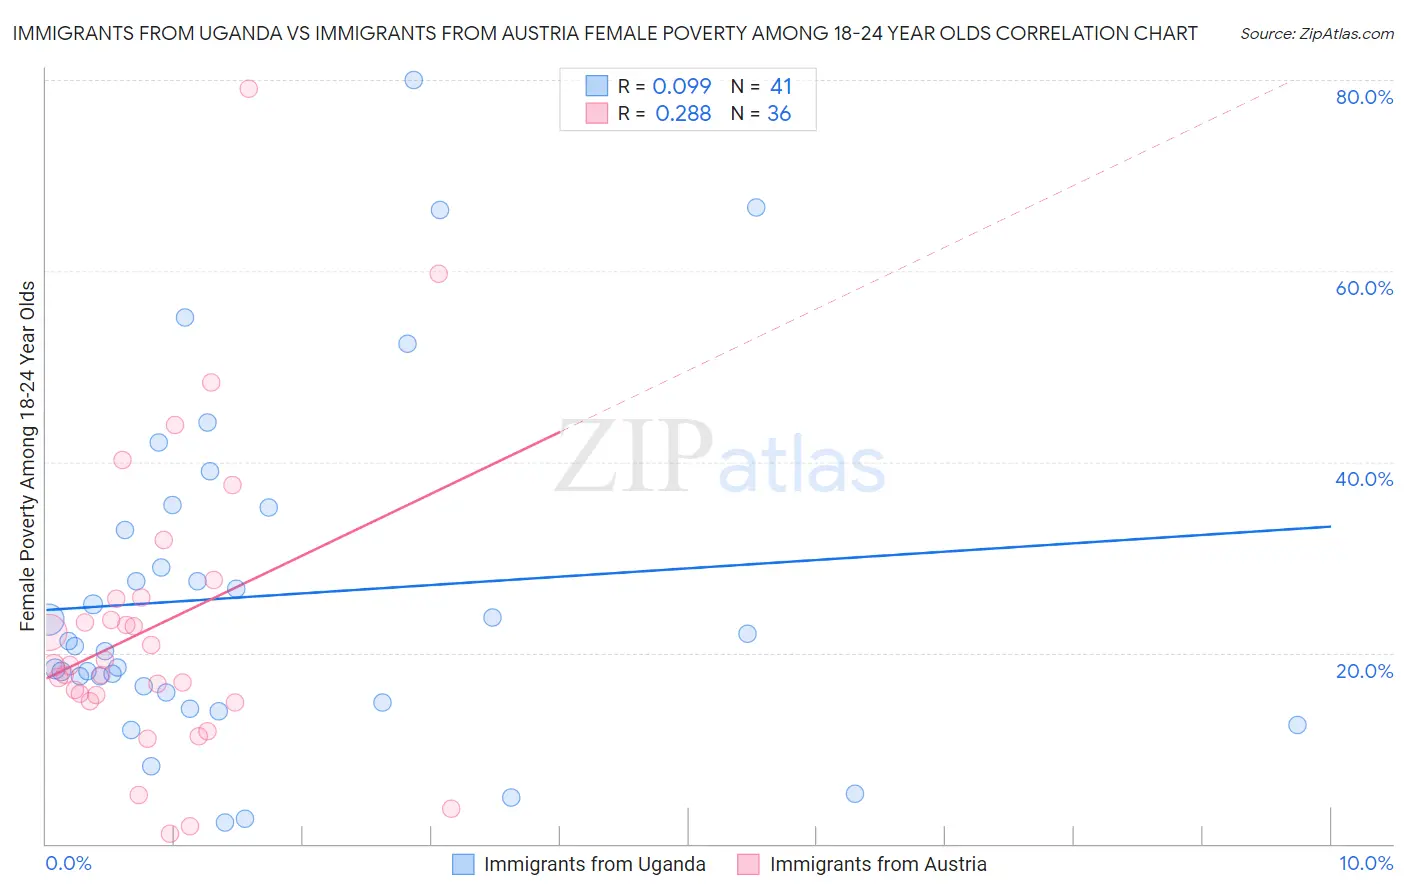
Immigrants from Uganda vs Immigrants from Austria Female Poverty Among 18-24 Year Olds Correlation Chart
The statistical analysis conducted on geographies consisting of 125,287,235 people shows a slight positive correlation between the proportion of Immigrants from Uganda and poverty level among females between the ages 18 and 24 in the United States with a correlation coefficient (R) of 0.099 and weighted average of 20.8%. Similarly, the statistical analysis conducted on geographies consisting of 165,272,500 people shows a weak positive correlation between the proportion of Immigrants from Austria and poverty level among females between the ages 18 and 24 in the United States with a correlation coefficient (R) of 0.288 and weighted average of 19.7%, a difference of 5.7%.
Female Poverty Among 18-24 Year Olds Correlation Summary
| Measurement | Immigrants from Uganda | Immigrants from Austria |
| Minimum | 2.2% | 1.0% |
| Maximum | 80.0% | 79.1% |
| Range | 77.8% | 78.0% |
| Mean | 26.0% | 22.8% |
| Median | 20.7% | 18.7% |
| Interquartile 25% (IQ1) | 15.3% | 15.3% |
| Interquartile 75% (IQ3) | 34.0% | 25.7% |
| Interquartile Range (IQR) | 18.7% | 10.4% |
| Standard Deviation (Sample) | 17.7% | 15.8% |
| Standard Deviation (Population) | 17.5% | 15.6% |
Similar Demographics by Female Poverty Among 18-24 Year Olds
Demographics Similar to Immigrants from Uganda by Female Poverty Among 18-24 Year Olds
In terms of female poverty among 18-24 year olds, the demographic groups most similar to Immigrants from Uganda are Okinawan (20.8%, a difference of 0.040%), Welsh (20.8%, a difference of 0.080%), Scottish (20.9%, a difference of 0.15%), Immigrants from Denmark (20.8%, a difference of 0.18%), and Immigrants from Singapore (20.9%, a difference of 0.18%).
| Demographics | Rating | Rank | Female Poverty Among 18-24 Year Olds |
| Ghanaians | 6.5 /100 | #228 | Tragic 20.8% |
| Australians | 6.1 /100 | #229 | Tragic 20.8% |
| Whites/Caucasians | 6.1 /100 | #230 | Tragic 20.8% |
| Immigrants | St. Vincent and the Grenadines | 6.0 /100 | #231 | Tragic 20.8% |
| Finns | 6.0 /100 | #232 | Tragic 20.8% |
| Immigrants | Denmark | 5.8 /100 | #233 | Tragic 20.8% |
| Welsh | 5.4 /100 | #234 | Tragic 20.8% |
| Immigrants | Uganda | 5.1 /100 | #235 | Tragic 20.8% |
| Okinawans | 4.9 /100 | #236 | Tragic 20.8% |
| Scottish | 4.5 /100 | #237 | Tragic 20.9% |
| Immigrants | Singapore | 4.4 /100 | #238 | Tragic 20.9% |
| Immigrants | Guatemala | 4.3 /100 | #239 | Tragic 20.9% |
| Luxembourgers | 4.2 /100 | #240 | Tragic 20.9% |
| Immigrants | Eritrea | 4.2 /100 | #241 | Tragic 20.9% |
| Israelis | 4.1 /100 | #242 | Tragic 20.9% |
Demographics Similar to Immigrants from Austria by Female Poverty Among 18-24 Year Olds
In terms of female poverty among 18-24 year olds, the demographic groups most similar to Immigrants from Austria are Immigrants from Bosnia and Herzegovina (19.7%, a difference of 0.050%), Canadian (19.7%, a difference of 0.060%), Immigrants from Northern Africa (19.7%, a difference of 0.090%), Slavic (19.7%, a difference of 0.12%), and Panamanian (19.7%, a difference of 0.13%).
| Demographics | Rating | Rank | Female Poverty Among 18-24 Year Olds |
| Immigrants | Trinidad and Tobago | 85.6 /100 | #140 | Excellent 19.7% |
| Pennsylvania Germans | 85.5 /100 | #141 | Excellent 19.7% |
| Panamanians | 84.6 /100 | #142 | Excellent 19.7% |
| Slavs | 84.4 /100 | #143 | Excellent 19.7% |
| Immigrants | Northern Africa | 84.1 /100 | #144 | Excellent 19.7% |
| Canadians | 83.8 /100 | #145 | Excellent 19.7% |
| Immigrants | Bosnia and Herzegovina | 83.6 /100 | #146 | Excellent 19.7% |
| Immigrants | Austria | 83.1 /100 | #147 | Excellent 19.7% |
| Immigrants | Latin America | 81.3 /100 | #148 | Excellent 19.7% |
| Immigrants | Oceania | 81.2 /100 | #149 | Excellent 19.7% |
| Syrians | 80.2 /100 | #150 | Excellent 19.8% |
| Immigrants | Eastern Asia | 79.7 /100 | #151 | Good 19.8% |
| Yugoslavians | 79.0 /100 | #152 | Good 19.8% |
| Immigrants | Japan | 78.1 /100 | #153 | Good 19.8% |
| Immigrants | Zimbabwe | 76.7 /100 | #154 | Good 19.8% |