Immigrants from Turkey vs Irish Female Poverty
COMPARE
Immigrants from Turkey
Irish
Female Poverty
Female Poverty Comparison
Immigrants from Turkey
Irish
12.6%
FEMALE POVERTY
93.8/ 100
METRIC RATING
106th/ 347
METRIC RANK
12.4%
FEMALE POVERTY
96.5/ 100
METRIC RATING
85th/ 347
METRIC RANK
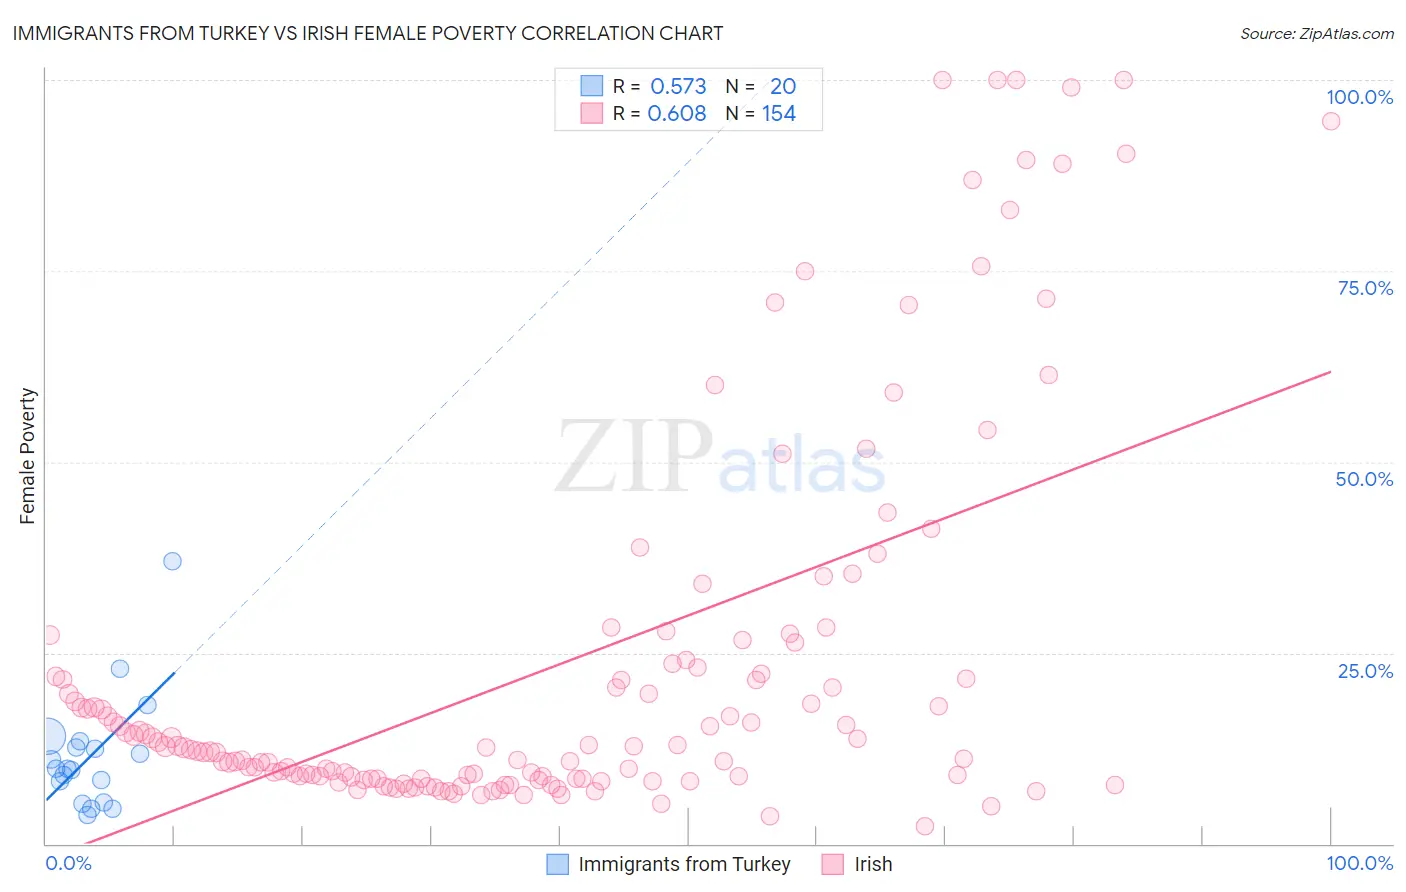
Immigrants from Turkey vs Irish Female Poverty Correlation Chart
The statistical analysis conducted on geographies consisting of 222,940,623 people shows a substantial positive correlation between the proportion of Immigrants from Turkey and poverty level among females in the United States with a correlation coefficient (R) of 0.573 and weighted average of 12.6%. Similarly, the statistical analysis conducted on geographies consisting of 578,836,064 people shows a significant positive correlation between the proportion of Irish and poverty level among females in the United States with a correlation coefficient (R) of 0.608 and weighted average of 12.4%, a difference of 1.6%.
Female Poverty Correlation Summary
| Measurement | Immigrants from Turkey | Irish |
| Minimum | 3.7% | 2.3% |
| Maximum | 37.0% | 100.0% |
| Range | 33.3% | 97.7% |
| Mean | 11.6% | 23.1% |
| Median | 9.8% | 12.6% |
| Interquartile 25% (IQ1) | 6.7% | 8.5% |
| Interquartile 75% (IQ3) | 13.0% | 23.0% |
| Interquartile Range (IQR) | 6.2% | 14.6% |
| Standard Deviation (Sample) | 7.6% | 24.9% |
| Standard Deviation (Population) | 7.4% | 24.8% |
Similar Demographics by Female Poverty
Demographics Similar to Immigrants from Turkey by Female Poverty
In terms of female poverty, the demographic groups most similar to Immigrants from Turkey are Scottish (12.5%, a difference of 0.12%), Laotian (12.6%, a difference of 0.19%), Palestinian (12.5%, a difference of 0.23%), Portuguese (12.6%, a difference of 0.29%), and Immigrants from Zimbabwe (12.6%, a difference of 0.31%).
| Demographics | Rating | Rank | Female Poverty |
| Romanians | 95.1 /100 | #99 | Exceptional 12.5% |
| Immigrants | Latvia | 94.8 /100 | #100 | Exceptional 12.5% |
| Tlingit-Haida | 94.8 /100 | #101 | Exceptional 12.5% |
| Immigrants | China | 94.5 /100 | #102 | Exceptional 12.5% |
| Slavs | 94.5 /100 | #103 | Exceptional 12.5% |
| Palestinians | 94.3 /100 | #104 | Exceptional 12.5% |
| Scottish | 94.1 /100 | #105 | Exceptional 12.5% |
| Immigrants | Turkey | 93.8 /100 | #106 | Exceptional 12.6% |
| Laotians | 93.4 /100 | #107 | Exceptional 12.6% |
| Portuguese | 93.1 /100 | #108 | Exceptional 12.6% |
| Immigrants | Zimbabwe | 93.1 /100 | #109 | Exceptional 12.6% |
| Paraguayans | 93.0 /100 | #110 | Exceptional 12.6% |
| Soviet Union | 92.4 /100 | #111 | Exceptional 12.6% |
| Immigrants | Israel | 92.0 /100 | #112 | Exceptional 12.6% |
| Canadians | 92.0 /100 | #113 | Exceptional 12.7% |
Demographics Similar to Irish by Female Poverty
In terms of female poverty, the demographic groups most similar to Irish are Dutch (12.4%, a difference of 0.030%), Northern European (12.4%, a difference of 0.050%), Okinawan (12.4%, a difference of 0.050%), Finnish (12.4%, a difference of 0.090%), and Immigrants from England (12.3%, a difference of 0.29%).
| Demographics | Rating | Rank | Female Poverty |
| Egyptians | 97.2 /100 | #78 | Exceptional 12.3% |
| Immigrants | North America | 97.1 /100 | #79 | Exceptional 12.3% |
| Slovaks | 97.1 /100 | #80 | Exceptional 12.3% |
| Immigrants | Sweden | 97.1 /100 | #81 | Exceptional 12.3% |
| Jordanians | 97.1 /100 | #82 | Exceptional 12.3% |
| Immigrants | England | 96.9 /100 | #83 | Exceptional 12.3% |
| Northern Europeans | 96.6 /100 | #84 | Exceptional 12.4% |
| Irish | 96.5 /100 | #85 | Exceptional 12.4% |
| Dutch | 96.5 /100 | #86 | Exceptional 12.4% |
| Okinawans | 96.4 /100 | #87 | Exceptional 12.4% |
| Finns | 96.4 /100 | #88 | Exceptional 12.4% |
| English | 96.1 /100 | #89 | Exceptional 12.4% |
| Immigrants | Denmark | 95.8 /100 | #90 | Exceptional 12.4% |
| Belgians | 95.8 /100 | #91 | Exceptional 12.4% |
| Czechoslovakians | 95.7 /100 | #92 | Exceptional 12.4% |