African vs Irish Female Poverty
COMPARE
African
Irish
Female Poverty
Female Poverty Comparison
Africans
Irish
16.9%
FEMALE POVERTY
0.0/ 100
METRIC RATING
308th/ 347
METRIC RANK
12.4%
FEMALE POVERTY
96.5/ 100
METRIC RATING
85th/ 347
METRIC RANK
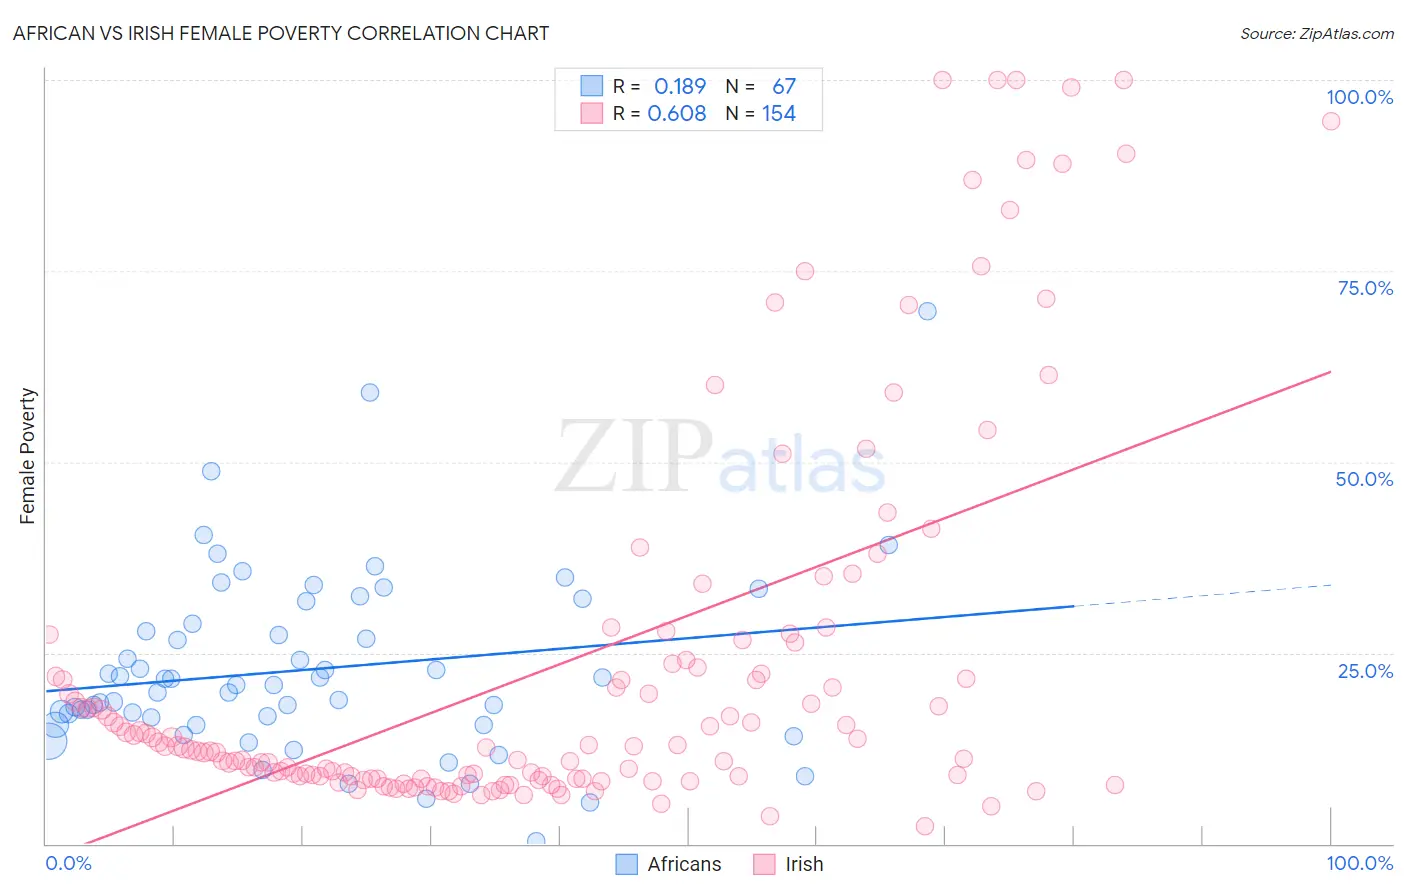
African vs Irish Female Poverty Correlation Chart
The statistical analysis conducted on geographies consisting of 469,508,235 people shows a poor positive correlation between the proportion of Africans and poverty level among females in the United States with a correlation coefficient (R) of 0.189 and weighted average of 16.9%. Similarly, the statistical analysis conducted on geographies consisting of 578,836,064 people shows a significant positive correlation between the proportion of Irish and poverty level among females in the United States with a correlation coefficient (R) of 0.608 and weighted average of 12.4%, a difference of 36.6%.
Female Poverty Correlation Summary
| Measurement | African | Irish |
| Minimum | 0.38% | 2.3% |
| Maximum | 69.8% | 100.0% |
| Range | 69.4% | 97.7% |
| Mean | 22.8% | 23.1% |
| Median | 20.8% | 12.6% |
| Interquartile 25% (IQ1) | 15.6% | 8.5% |
| Interquartile 75% (IQ3) | 28.8% | 23.0% |
| Interquartile Range (IQR) | 13.2% | 14.6% |
| Standard Deviation (Sample) | 12.0% | 24.9% |
| Standard Deviation (Population) | 11.9% | 24.8% |
Similar Demographics by Female Poverty
Demographics Similar to Africans by Female Poverty
In terms of female poverty, the demographic groups most similar to Africans are Seminole (16.9%, a difference of 0.060%), Immigrants from Caribbean (16.9%, a difference of 0.19%), Immigrants from Mexico (17.0%, a difference of 0.39%), Immigrants from Grenada (16.8%, a difference of 0.45%), and Immigrants from Central America (16.8%, a difference of 0.46%).
| Demographics | Rating | Rank | Female Poverty |
| Guatemalans | 0.0 /100 | #301 | Tragic 16.7% |
| Chippewa | 0.0 /100 | #302 | Tragic 16.7% |
| Choctaw | 0.0 /100 | #303 | Tragic 16.8% |
| Immigrants | Central America | 0.0 /100 | #304 | Tragic 16.8% |
| Immigrants | Grenada | 0.0 /100 | #305 | Tragic 16.8% |
| Immigrants | Caribbean | 0.0 /100 | #306 | Tragic 16.9% |
| Seminole | 0.0 /100 | #307 | Tragic 16.9% |
| Africans | 0.0 /100 | #308 | Tragic 16.9% |
| Immigrants | Mexico | 0.0 /100 | #309 | Tragic 17.0% |
| Creek | 0.0 /100 | #310 | Tragic 17.0% |
| Immigrants | Guatemala | 0.0 /100 | #311 | Tragic 17.0% |
| Immigrants | Somalia | 0.0 /100 | #312 | Tragic 17.0% |
| British West Indians | 0.0 /100 | #313 | Tragic 17.0% |
| Dutch West Indians | 0.0 /100 | #314 | Tragic 17.1% |
| U.S. Virgin Islanders | 0.0 /100 | #315 | Tragic 17.3% |
Demographics Similar to Irish by Female Poverty
In terms of female poverty, the demographic groups most similar to Irish are Dutch (12.4%, a difference of 0.030%), Northern European (12.4%, a difference of 0.050%), Okinawan (12.4%, a difference of 0.050%), Finnish (12.4%, a difference of 0.090%), and Immigrants from England (12.3%, a difference of 0.29%).
| Demographics | Rating | Rank | Female Poverty |
| Egyptians | 97.2 /100 | #78 | Exceptional 12.3% |
| Immigrants | North America | 97.1 /100 | #79 | Exceptional 12.3% |
| Slovaks | 97.1 /100 | #80 | Exceptional 12.3% |
| Immigrants | Sweden | 97.1 /100 | #81 | Exceptional 12.3% |
| Jordanians | 97.1 /100 | #82 | Exceptional 12.3% |
| Immigrants | England | 96.9 /100 | #83 | Exceptional 12.3% |
| Northern Europeans | 96.6 /100 | #84 | Exceptional 12.4% |
| Irish | 96.5 /100 | #85 | Exceptional 12.4% |
| Dutch | 96.5 /100 | #86 | Exceptional 12.4% |
| Okinawans | 96.4 /100 | #87 | Exceptional 12.4% |
| Finns | 96.4 /100 | #88 | Exceptional 12.4% |
| English | 96.1 /100 | #89 | Exceptional 12.4% |
| Immigrants | Denmark | 95.8 /100 | #90 | Exceptional 12.4% |
| Belgians | 95.8 /100 | #91 | Exceptional 12.4% |
| Czechoslovakians | 95.7 /100 | #92 | Exceptional 12.4% |