Immigrants from Trinidad and Tobago vs British West Indian Child Poverty Among Boys Under 16
COMPARE
Immigrants from Trinidad and Tobago
British West Indian
Child Poverty Among Boys Under 16
Child Poverty Among Boys Under 16 Comparison
Immigrants from Trinidad and Tobago
British West Indians
19.0%
CHILD POVERTY AMONG BOYS UNDER 16
0.3/ 100
METRIC RATING
247th/ 347
METRIC RANK
21.6%
CHILD POVERTY AMONG BOYS UNDER 16
0.0/ 100
METRIC RATING
313th/ 347
METRIC RANK
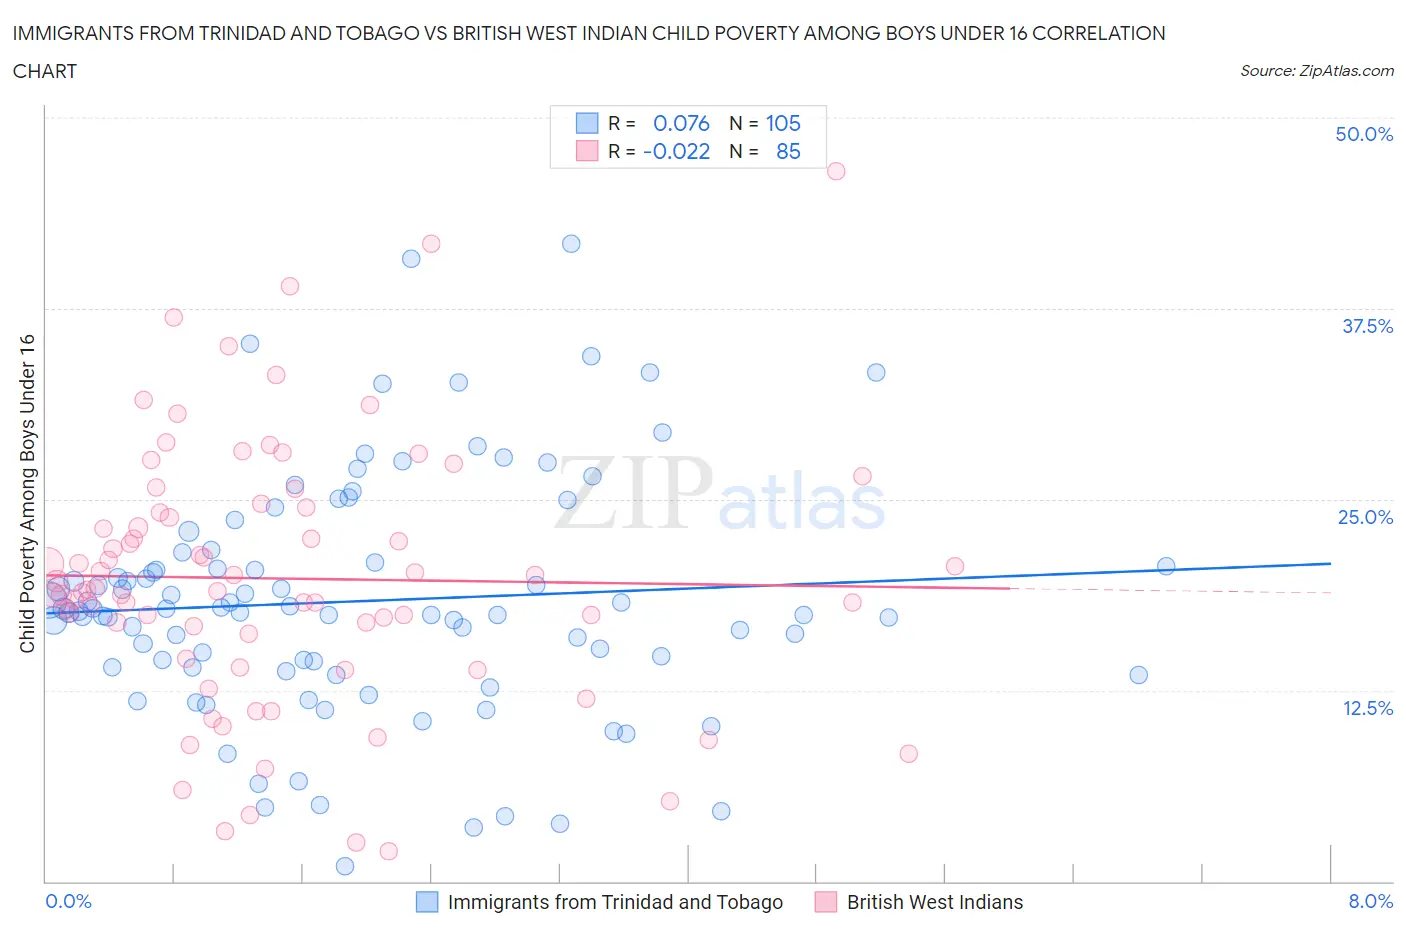
Immigrants from Trinidad and Tobago vs British West Indian Child Poverty Among Boys Under 16 Correlation Chart
The statistical analysis conducted on geographies consisting of 221,543,811 people shows a slight positive correlation between the proportion of Immigrants from Trinidad and Tobago and poverty level among boys under the age of 16 in the United States with a correlation coefficient (R) of 0.076 and weighted average of 19.0%. Similarly, the statistical analysis conducted on geographies consisting of 151,753,314 people shows no correlation between the proportion of British West Indians and poverty level among boys under the age of 16 in the United States with a correlation coefficient (R) of -0.022 and weighted average of 21.6%, a difference of 13.4%.
Child Poverty Among Boys Under 16 Correlation Summary
| Measurement | Immigrants from Trinidad and Tobago | British West Indian |
| Minimum | 0.94% | 2.0% |
| Maximum | 41.7% | 46.4% |
| Range | 40.8% | 44.5% |
| Mean | 18.3% | 19.8% |
| Median | 17.7% | 19.1% |
| Interquartile 25% (IQ1) | 14.0% | 15.4% |
| Interquartile 75% (IQ3) | 21.2% | 24.3% |
| Interquartile Range (IQR) | 7.2% | 8.9% |
| Standard Deviation (Sample) | 7.8% | 8.6% |
| Standard Deviation (Population) | 7.7% | 8.5% |
Similar Demographics by Child Poverty Among Boys Under 16
Demographics Similar to Immigrants from Trinidad and Tobago by Child Poverty Among Boys Under 16
In terms of child poverty among boys under 16, the demographic groups most similar to Immigrants from Trinidad and Tobago are Salvadoran (19.0%, a difference of 0.080%), Immigrants from Nicaragua (19.0%, a difference of 0.12%), Alsatian (19.1%, a difference of 0.25%), Cree (19.0%, a difference of 0.32%), and Immigrants from Middle Africa (18.9%, a difference of 0.45%).
| Demographics | Rating | Rank | Child Poverty Among Boys Under 16 |
| Immigrants | Cuba | 0.6 /100 | #240 | Tragic 18.8% |
| Immigrants | Sudan | 0.6 /100 | #241 | Tragic 18.8% |
| Ghanaians | 0.5 /100 | #242 | Tragic 18.9% |
| Immigrants | Azores | 0.4 /100 | #243 | Tragic 18.9% |
| Immigrants | Middle Africa | 0.4 /100 | #244 | Tragic 18.9% |
| Cree | 0.4 /100 | #245 | Tragic 19.0% |
| Immigrants | Nicaragua | 0.4 /100 | #246 | Tragic 19.0% |
| Immigrants | Trinidad and Tobago | 0.3 /100 | #247 | Tragic 19.0% |
| Salvadorans | 0.3 /100 | #248 | Tragic 19.0% |
| Alsatians | 0.3 /100 | #249 | Tragic 19.1% |
| Immigrants | Burma/Myanmar | 0.2 /100 | #250 | Tragic 19.2% |
| French American Indians | 0.2 /100 | #251 | Tragic 19.2% |
| Immigrants | Western Africa | 0.2 /100 | #252 | Tragic 19.3% |
| Liberians | 0.2 /100 | #253 | Tragic 19.3% |
| Trinidadians and Tobagonians | 0.2 /100 | #254 | Tragic 19.3% |
Demographics Similar to British West Indians by Child Poverty Among Boys Under 16
In terms of child poverty among boys under 16, the demographic groups most similar to British West Indians are Immigrants from Guatemala (21.6%, a difference of 0.0%), Ute (21.6%, a difference of 0.010%), Bahamian (21.6%, a difference of 0.090%), Creek (21.5%, a difference of 0.20%), and Seminole (21.5%, a difference of 0.26%).
| Demographics | Rating | Rank | Child Poverty Among Boys Under 16 |
| Immigrants | Grenada | 0.0 /100 | #306 | Tragic 21.3% |
| Choctaw | 0.0 /100 | #307 | Tragic 21.3% |
| Immigrants | Mexico | 0.0 /100 | #308 | Tragic 21.5% |
| Seminole | 0.0 /100 | #309 | Tragic 21.5% |
| Creek | 0.0 /100 | #310 | Tragic 21.5% |
| Bahamians | 0.0 /100 | #311 | Tragic 21.6% |
| Immigrants | Guatemala | 0.0 /100 | #312 | Tragic 21.6% |
| British West Indians | 0.0 /100 | #313 | Tragic 21.6% |
| Ute | 0.0 /100 | #314 | Tragic 21.6% |
| Immigrants | Somalia | 0.0 /100 | #315 | Tragic 21.7% |
| Menominee | 0.0 /100 | #316 | Tragic 21.7% |
| Africans | 0.0 /100 | #317 | Tragic 21.7% |
| Yakama | 0.0 /100 | #318 | Tragic 21.7% |
| Dutch West Indians | 0.0 /100 | #319 | Tragic 21.8% |
| U.S. Virgin Islanders | 0.0 /100 | #320 | Tragic 22.0% |