Immigrants from Thailand vs Finnish Male Poverty
COMPARE
Immigrants from Thailand
Finnish
Male Poverty
Male Poverty Comparison
Immigrants from Thailand
Finns
12.2%
MALE POVERTY
2.5/ 100
METRIC RATING
217th/ 347
METRIC RANK
10.5%
MALE POVERTY
93.4/ 100
METRIC RATING
98th/ 347
METRIC RANK
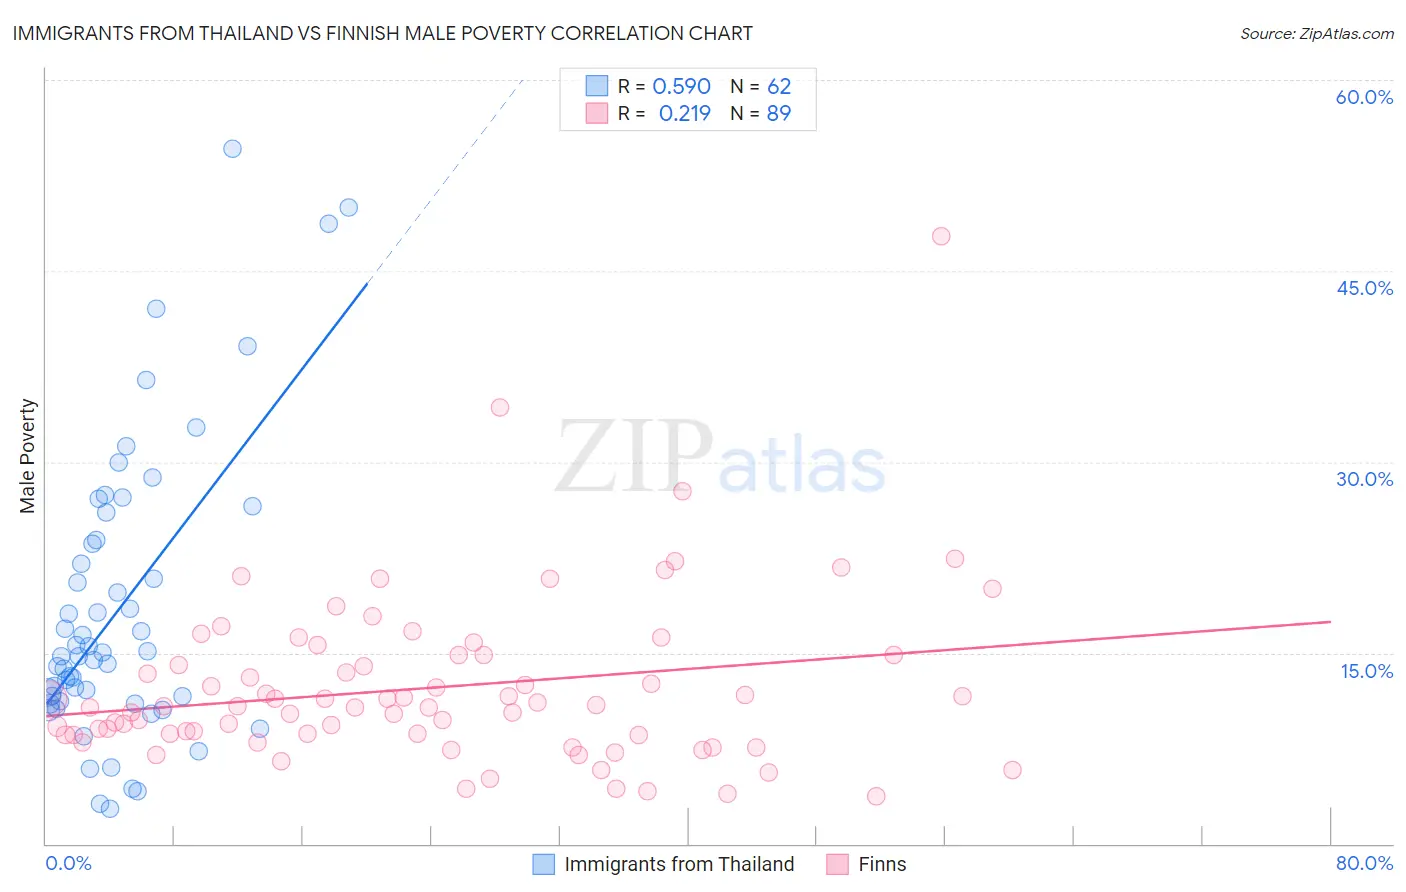
Immigrants from Thailand vs Finnish Male Poverty Correlation Chart
The statistical analysis conducted on geographies consisting of 316,895,557 people shows a substantial positive correlation between the proportion of Immigrants from Thailand and poverty level among males in the United States with a correlation coefficient (R) of 0.590 and weighted average of 12.2%. Similarly, the statistical analysis conducted on geographies consisting of 404,315,970 people shows a weak positive correlation between the proportion of Finns and poverty level among males in the United States with a correlation coefficient (R) of 0.219 and weighted average of 10.5%, a difference of 16.6%.
Male Poverty Correlation Summary
| Measurement | Immigrants from Thailand | Finnish |
| Minimum | 2.7% | 3.8% |
| Maximum | 54.6% | 47.7% |
| Range | 51.9% | 43.9% |
| Mean | 18.5% | 12.3% |
| Median | 14.9% | 10.8% |
| Interquartile 25% (IQ1) | 11.2% | 8.6% |
| Interquartile 75% (IQ3) | 23.8% | 14.8% |
| Interquartile Range (IQR) | 12.6% | 6.3% |
| Standard Deviation (Sample) | 11.4% | 6.6% |
| Standard Deviation (Population) | 11.3% | 6.6% |
Similar Demographics by Male Poverty
Demographics Similar to Immigrants from Thailand by Male Poverty
In terms of male poverty, the demographic groups most similar to Immigrants from Thailand are Immigrants from Cambodia (12.2%, a difference of 0.010%), German Russian (12.2%, a difference of 0.020%), Immigrants from Uzbekistan (12.2%, a difference of 0.090%), Bermudan (12.2%, a difference of 0.090%), and Immigrants from Eritrea (12.2%, a difference of 0.11%).
| Demographics | Rating | Rank | Male Poverty |
| Moroccans | 4.2 /100 | #210 | Tragic 12.0% |
| Immigrants | Panama | 4.0 /100 | #211 | Tragic 12.1% |
| Americans | 3.2 /100 | #212 | Tragic 12.1% |
| Immigrants | Nonimmigrants | 3.1 /100 | #213 | Tragic 12.1% |
| Japanese | 2.7 /100 | #214 | Tragic 12.2% |
| Immigrants | Uzbekistan | 2.6 /100 | #215 | Tragic 12.2% |
| Immigrants | Cambodia | 2.5 /100 | #216 | Tragic 12.2% |
| Immigrants | Thailand | 2.5 /100 | #217 | Tragic 12.2% |
| German Russians | 2.5 /100 | #218 | Tragic 12.2% |
| Bermudans | 2.4 /100 | #219 | Tragic 12.2% |
| Immigrants | Eritrea | 2.4 /100 | #220 | Tragic 12.2% |
| Ugandans | 2.2 /100 | #221 | Tragic 12.2% |
| Immigrants | Africa | 2.1 /100 | #222 | Tragic 12.2% |
| Immigrants | Micronesia | 2.1 /100 | #223 | Tragic 12.2% |
| Immigrants | Nigeria | 1.6 /100 | #224 | Tragic 12.3% |
Demographics Similar to Finns by Male Poverty
In terms of male poverty, the demographic groups most similar to Finns are Romanian (10.5%, a difference of 0.060%), Immigrants from Indonesia (10.5%, a difference of 0.060%), Immigrants from Egypt (10.4%, a difference of 0.11%), Scottish (10.4%, a difference of 0.24%), and Immigrants from South Africa (10.4%, a difference of 0.28%).
| Demographics | Rating | Rank | Male Poverty |
| British | 94.8 /100 | #91 | Exceptional 10.4% |
| Jordanians | 94.4 /100 | #92 | Exceptional 10.4% |
| Australians | 94.4 /100 | #93 | Exceptional 10.4% |
| Immigrants | South Africa | 94.1 /100 | #94 | Exceptional 10.4% |
| Scottish | 94.0 /100 | #95 | Exceptional 10.4% |
| Immigrants | Egypt | 93.7 /100 | #96 | Exceptional 10.4% |
| Romanians | 93.6 /100 | #97 | Exceptional 10.5% |
| Finns | 93.4 /100 | #98 | Exceptional 10.5% |
| Immigrants | Indonesia | 93.3 /100 | #99 | Exceptional 10.5% |
| Immigrants | Latvia | 92.8 /100 | #100 | Exceptional 10.5% |
| Immigrants | Zimbabwe | 92.0 /100 | #101 | Exceptional 10.5% |
| French Canadians | 91.9 /100 | #102 | Exceptional 10.5% |
| Slavs | 91.7 /100 | #103 | Exceptional 10.5% |
| Welsh | 91.6 /100 | #104 | Exceptional 10.5% |
| Canadians | 91.6 /100 | #105 | Exceptional 10.5% |