Immigrants from Switzerland vs Macedonian Child Poverty Under the Age of 5
COMPARE
Immigrants from Switzerland
Macedonian
Child Poverty Under the Age of 5
Child Poverty Under the Age of 5 Comparison
Immigrants from Switzerland
Macedonians
15.8%
CHILD POVERTY UNDER THE AGE OF 5
96.4/ 100
METRIC RATING
95th/ 347
METRIC RANK
15.8%
CHILD POVERTY UNDER THE AGE OF 5
96.2/ 100
METRIC RATING
97th/ 347
METRIC RANK
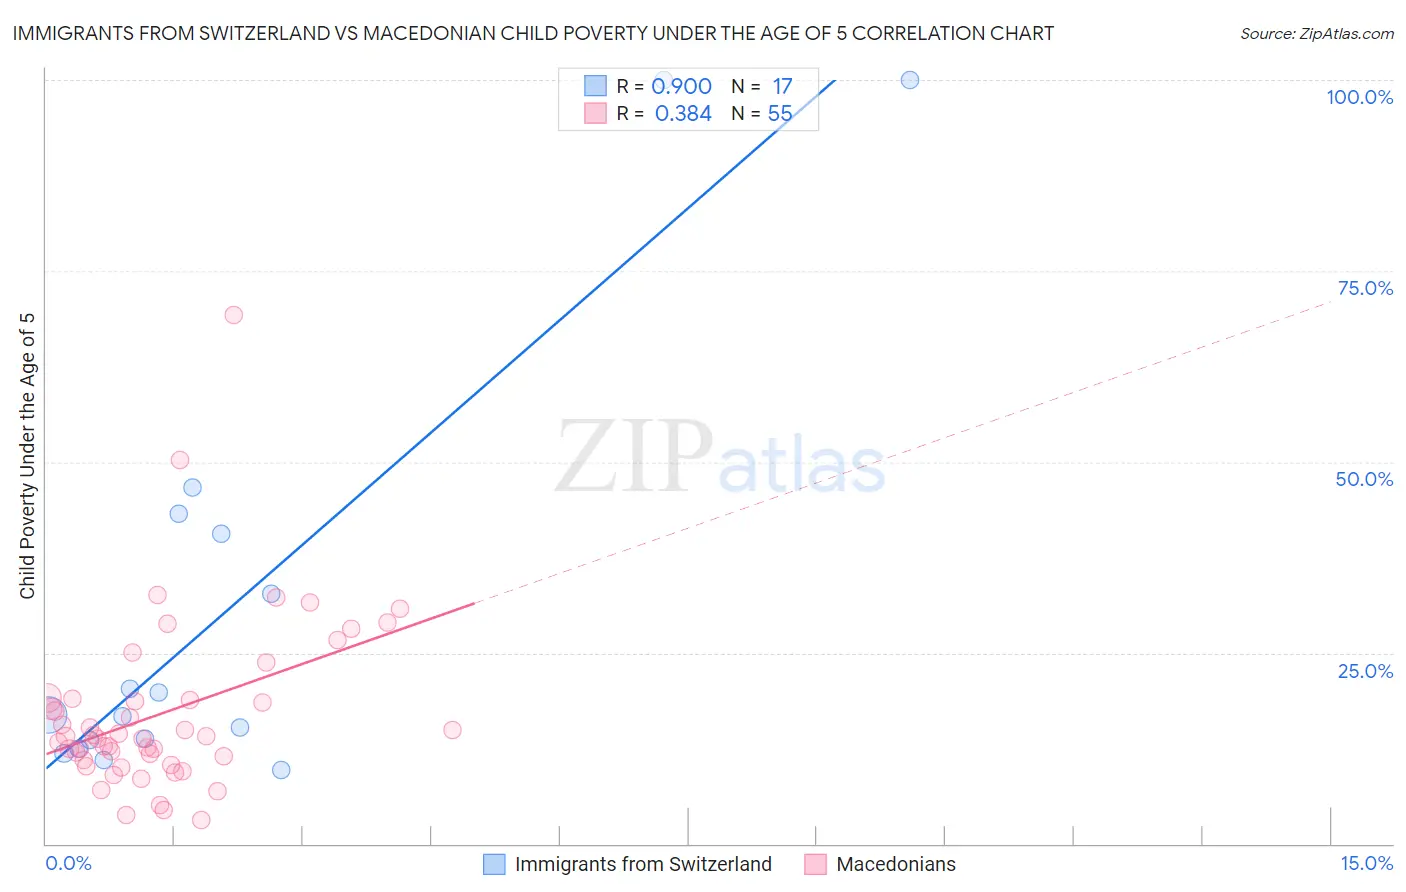
Immigrants from Switzerland vs Macedonian Child Poverty Under the Age of 5 Correlation Chart
The statistical analysis conducted on geographies consisting of 143,009,400 people shows a near-perfect positive correlation between the proportion of Immigrants from Switzerland and poverty level among children under the age of 5 in the United States with a correlation coefficient (R) of 0.900 and weighted average of 15.8%. Similarly, the statistical analysis conducted on geographies consisting of 129,119,127 people shows a mild positive correlation between the proportion of Macedonians and poverty level among children under the age of 5 in the United States with a correlation coefficient (R) of 0.384 and weighted average of 15.8%, a difference of 0.17%.
Child Poverty Under the Age of 5 Correlation Summary
| Measurement | Immigrants from Switzerland | Macedonian |
| Minimum | 9.7% | 3.1% |
| Maximum | 100.0% | 69.2% |
| Range | 90.3% | 66.1% |
| Mean | 30.8% | 17.1% |
| Median | 16.8% | 14.1% |
| Interquartile 25% (IQ1) | 13.0% | 11.0% |
| Interquartile 75% (IQ3) | 41.9% | 19.0% |
| Interquartile Range (IQR) | 28.9% | 7.9% |
| Standard Deviation (Sample) | 28.6% | 11.3% |
| Standard Deviation (Population) | 27.7% | 11.2% |
Demographics Similar to Immigrants from Switzerland and Macedonians by Child Poverty Under the Age of 5
In terms of child poverty under the age of 5, the demographic groups most similar to Immigrants from Switzerland are Immigrants from Kazakhstan (15.8%, a difference of 0.13%), Immigrants from South Africa (15.8%, a difference of 0.24%), Palestinian (15.8%, a difference of 0.35%), Immigrants from Canada (15.8%, a difference of 0.36%), and Immigrants from Zimbabwe (15.8%, a difference of 0.37%). Similarly, the demographic groups most similar to Macedonians are Immigrants from Kazakhstan (15.8%, a difference of 0.040%), Immigrants from South Africa (15.8%, a difference of 0.070%), Palestinian (15.8%, a difference of 0.18%), Immigrants from Canada (15.8%, a difference of 0.20%), and Immigrants from Zimbabwe (15.8%, a difference of 0.20%).
| Demographics | Rating | Rank | Child Poverty Under the Age of 5 |
| Immigrants | Malaysia | 97.4 /100 | #86 | Exceptional 15.6% |
| Immigrants | Vietnam | 97.4 /100 | #87 | Exceptional 15.6% |
| Jordanians | 97.3 /100 | #88 | Exceptional 15.6% |
| Immigrants | Croatia | 97.3 /100 | #89 | Exceptional 15.6% |
| Immigrants | France | 97.3 /100 | #90 | Exceptional 15.6% |
| Poles | 97.2 /100 | #91 | Exceptional 15.7% |
| Scandinavians | 97.1 /100 | #92 | Exceptional 15.7% |
| Ukrainians | 97.1 /100 | #93 | Exceptional 15.7% |
| Immigrants | South Eastern Asia | 97.1 /100 | #94 | Exceptional 15.7% |
| Immigrants | Switzerland | 96.4 /100 | #95 | Exceptional 15.8% |
| Immigrants | Kazakhstan | 96.2 /100 | #96 | Exceptional 15.8% |
| Macedonians | 96.2 /100 | #97 | Exceptional 15.8% |
| Immigrants | South Africa | 96.1 /100 | #98 | Exceptional 15.8% |
| Palestinians | 95.9 /100 | #99 | Exceptional 15.8% |
| Immigrants | Canada | 95.9 /100 | #100 | Exceptional 15.8% |
| Immigrants | Zimbabwe | 95.9 /100 | #101 | Exceptional 15.8% |
| Armenians | 95.7 /100 | #102 | Exceptional 15.8% |
| Europeans | 95.3 /100 | #103 | Exceptional 15.9% |
| Immigrants | North America | 94.9 /100 | #104 | Exceptional 15.9% |
| Immigrants | Spain | 94.8 /100 | #105 | Exceptional 15.9% |
| Tlingit-Haida | 94.7 /100 | #106 | Exceptional 15.9% |