Immigrants from Switzerland vs Immigrants from Guyana Child Poverty Among Boys Under 16
COMPARE
Immigrants from Switzerland
Immigrants from Guyana
Child Poverty Among Boys Under 16
Child Poverty Among Boys Under 16 Comparison
Immigrants from Switzerland
Immigrants from Guyana
15.0%
CHILD POVERTY AMONG BOYS UNDER 16
95.4/ 100
METRIC RATING
104th/ 347
METRIC RANK
19.5%
CHILD POVERTY AMONG BOYS UNDER 16
0.1/ 100
METRIC RATING
262nd/ 347
METRIC RANK
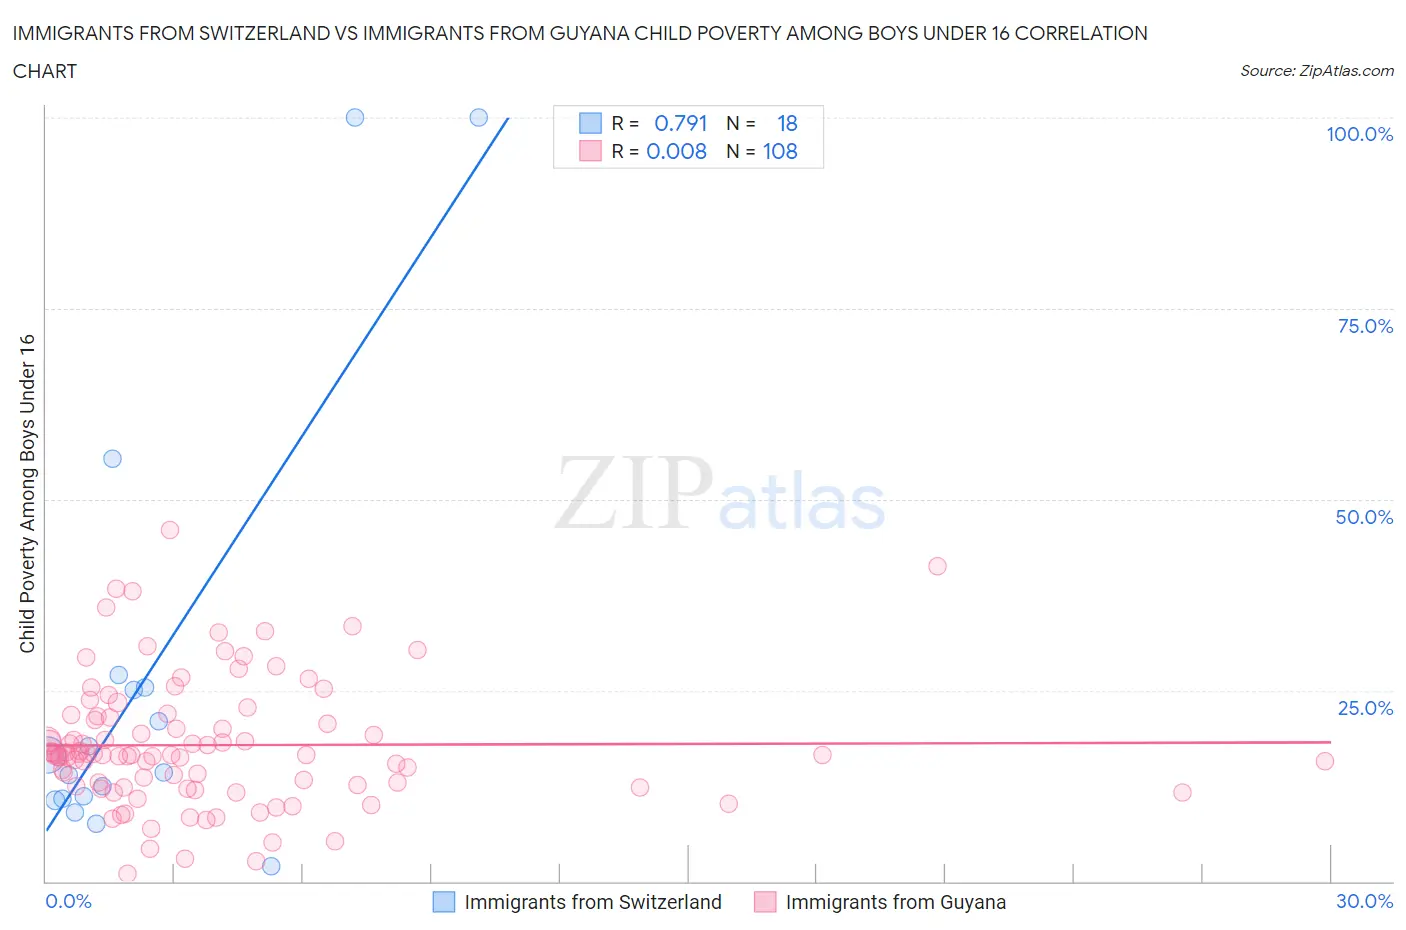
Immigrants from Switzerland vs Immigrants from Guyana Child Poverty Among Boys Under 16 Correlation Chart
The statistical analysis conducted on geographies consisting of 146,543,918 people shows a strong positive correlation between the proportion of Immigrants from Switzerland and poverty level among boys under the age of 16 in the United States with a correlation coefficient (R) of 0.791 and weighted average of 15.0%. Similarly, the statistical analysis conducted on geographies consisting of 181,993,075 people shows no correlation between the proportion of Immigrants from Guyana and poverty level among boys under the age of 16 in the United States with a correlation coefficient (R) of 0.008 and weighted average of 19.5%, a difference of 29.4%.
Child Poverty Among Boys Under 16 Correlation Summary
| Measurement | Immigrants from Switzerland | Immigrants from Guyana |
| Minimum | 2.0% | 1.0% |
| Maximum | 100.0% | 46.0% |
| Range | 98.0% | 45.0% |
| Mean | 26.6% | 17.8% |
| Median | 15.4% | 16.5% |
| Interquartile 25% (IQ1) | 10.8% | 12.4% |
| Interquartile 75% (IQ3) | 25.4% | 21.5% |
| Interquartile Range (IQR) | 14.6% | 9.1% |
| Standard Deviation (Sample) | 29.1% | 8.4% |
| Standard Deviation (Population) | 28.2% | 8.3% |
Similar Demographics by Child Poverty Among Boys Under 16
Demographics Similar to Immigrants from Switzerland by Child Poverty Among Boys Under 16
In terms of child poverty among boys under 16, the demographic groups most similar to Immigrants from Switzerland are Dutch (15.0%, a difference of 0.010%), Immigrants from Denmark (15.0%, a difference of 0.10%), Serbian (15.1%, a difference of 0.13%), Romanian (15.0%, a difference of 0.14%), and Immigrants from Belarus (15.0%, a difference of 0.21%).
| Demographics | Rating | Rank | Child Poverty Among Boys Under 16 |
| Immigrants | Egypt | 96.2 /100 | #97 | Exceptional 14.9% |
| British | 96.2 /100 | #98 | Exceptional 15.0% |
| Immigrants | France | 96.1 /100 | #99 | Exceptional 15.0% |
| Chileans | 95.8 /100 | #100 | Exceptional 15.0% |
| Immigrants | Belarus | 95.7 /100 | #101 | Exceptional 15.0% |
| Romanians | 95.6 /100 | #102 | Exceptional 15.0% |
| Immigrants | Denmark | 95.6 /100 | #103 | Exceptional 15.0% |
| Immigrants | Switzerland | 95.4 /100 | #104 | Exceptional 15.0% |
| Dutch | 95.4 /100 | #105 | Exceptional 15.0% |
| Serbians | 95.2 /100 | #106 | Exceptional 15.1% |
| Jordanians | 95.1 /100 | #107 | Exceptional 15.1% |
| Immigrants | England | 94.8 /100 | #108 | Exceptional 15.1% |
| Pakistanis | 94.7 /100 | #109 | Exceptional 15.1% |
| English | 94.3 /100 | #110 | Exceptional 15.1% |
| Immigrants | Zimbabwe | 94.2 /100 | #111 | Exceptional 15.2% |
Demographics Similar to Immigrants from Guyana by Child Poverty Among Boys Under 16
In terms of child poverty among boys under 16, the demographic groups most similar to Immigrants from Guyana are Ottawa (19.5%, a difference of 0.31%), Immigrants from Ghana (19.4%, a difference of 0.32%), Shoshone (19.4%, a difference of 0.34%), Spanish American (19.4%, a difference of 0.44%), and Potawatomi (19.4%, a difference of 0.46%).
| Demographics | Rating | Rank | Child Poverty Among Boys Under 16 |
| Ecuadorians | 0.2 /100 | #255 | Tragic 19.3% |
| Immigrants | Liberia | 0.2 /100 | #256 | Tragic 19.3% |
| Mexican American Indians | 0.2 /100 | #257 | Tragic 19.4% |
| Potawatomi | 0.2 /100 | #258 | Tragic 19.4% |
| Spanish Americans | 0.2 /100 | #259 | Tragic 19.4% |
| Shoshone | 0.2 /100 | #260 | Tragic 19.4% |
| Immigrants | Ghana | 0.2 /100 | #261 | Tragic 19.4% |
| Immigrants | Guyana | 0.1 /100 | #262 | Tragic 19.5% |
| Ottawa | 0.1 /100 | #263 | Tragic 19.5% |
| Iroquois | 0.1 /100 | #264 | Tragic 19.6% |
| Guyanese | 0.1 /100 | #265 | Tragic 19.6% |
| Immigrants | El Salvador | 0.1 /100 | #266 | Tragic 19.6% |
| Vietnamese | 0.1 /100 | #267 | Tragic 19.6% |
| Spanish American Indians | 0.1 /100 | #268 | Tragic 19.6% |
| Immigrants | Cabo Verde | 0.1 /100 | #269 | Tragic 19.7% |