Immigrants from Switzerland vs Thai Child Poverty Among Boys Under 16
COMPARE
Immigrants from Switzerland
Thai
Child Poverty Among Boys Under 16
Child Poverty Among Boys Under 16 Comparison
Immigrants from Switzerland
Thais
15.0%
CHILD POVERTY AMONG BOYS UNDER 16
95.4/ 100
METRIC RATING
104th/ 347
METRIC RANK
11.7%
CHILD POVERTY AMONG BOYS UNDER 16
100.0/ 100
METRIC RATING
4th/ 347
METRIC RANK
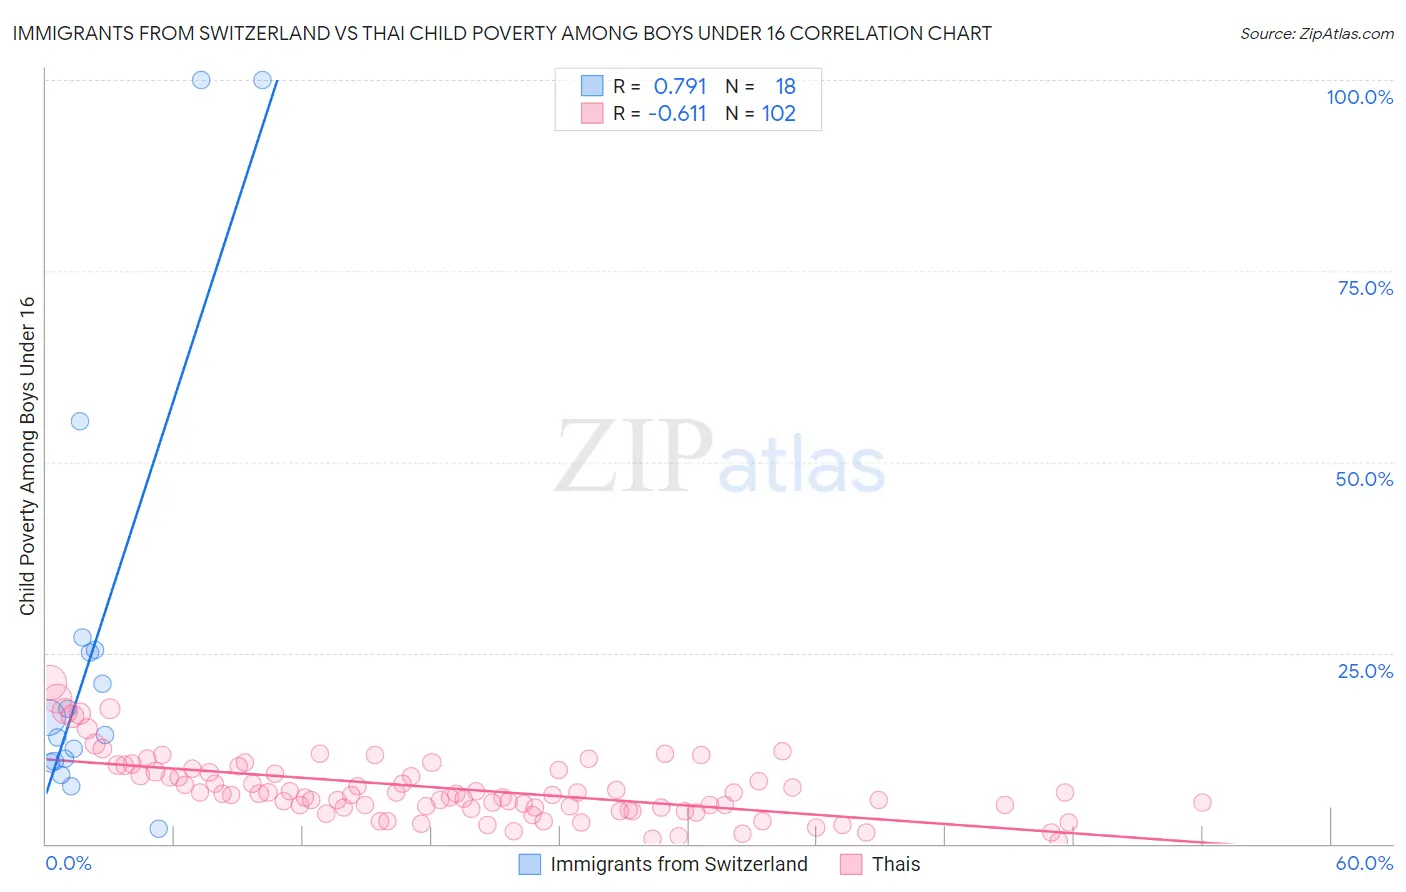
Immigrants from Switzerland vs Thai Child Poverty Among Boys Under 16 Correlation Chart
The statistical analysis conducted on geographies consisting of 146,543,918 people shows a strong positive correlation between the proportion of Immigrants from Switzerland and poverty level among boys under the age of 16 in the United States with a correlation coefficient (R) of 0.791 and weighted average of 15.0%. Similarly, the statistical analysis conducted on geographies consisting of 465,293,416 people shows a significant negative correlation between the proportion of Thais and poverty level among boys under the age of 16 in the United States with a correlation coefficient (R) of -0.611 and weighted average of 11.7%, a difference of 28.8%.
Child Poverty Among Boys Under 16 Correlation Summary
| Measurement | Immigrants from Switzerland | Thai |
| Minimum | 2.0% | 0.37% |
| Maximum | 100.0% | 21.1% |
| Range | 98.0% | 20.7% |
| Mean | 26.6% | 7.2% |
| Median | 15.4% | 6.4% |
| Interquartile 25% (IQ1) | 10.8% | 4.7% |
| Interquartile 75% (IQ3) | 25.4% | 9.4% |
| Interquartile Range (IQR) | 14.6% | 4.7% |
| Standard Deviation (Sample) | 29.1% | 4.1% |
| Standard Deviation (Population) | 28.2% | 4.1% |
Similar Demographics by Child Poverty Among Boys Under 16
Demographics Similar to Immigrants from Switzerland by Child Poverty Among Boys Under 16
In terms of child poverty among boys under 16, the demographic groups most similar to Immigrants from Switzerland are Dutch (15.0%, a difference of 0.010%), Immigrants from Denmark (15.0%, a difference of 0.10%), Serbian (15.1%, a difference of 0.13%), Romanian (15.0%, a difference of 0.14%), and Immigrants from Belarus (15.0%, a difference of 0.21%).
| Demographics | Rating | Rank | Child Poverty Among Boys Under 16 |
| Immigrants | Egypt | 96.2 /100 | #97 | Exceptional 14.9% |
| British | 96.2 /100 | #98 | Exceptional 15.0% |
| Immigrants | France | 96.1 /100 | #99 | Exceptional 15.0% |
| Chileans | 95.8 /100 | #100 | Exceptional 15.0% |
| Immigrants | Belarus | 95.7 /100 | #101 | Exceptional 15.0% |
| Romanians | 95.6 /100 | #102 | Exceptional 15.0% |
| Immigrants | Denmark | 95.6 /100 | #103 | Exceptional 15.0% |
| Immigrants | Switzerland | 95.4 /100 | #104 | Exceptional 15.0% |
| Dutch | 95.4 /100 | #105 | Exceptional 15.0% |
| Serbians | 95.2 /100 | #106 | Exceptional 15.1% |
| Jordanians | 95.1 /100 | #107 | Exceptional 15.1% |
| Immigrants | England | 94.8 /100 | #108 | Exceptional 15.1% |
| Pakistanis | 94.7 /100 | #109 | Exceptional 15.1% |
| English | 94.3 /100 | #110 | Exceptional 15.1% |
| Immigrants | Zimbabwe | 94.2 /100 | #111 | Exceptional 15.2% |
Demographics Similar to Thais by Child Poverty Among Boys Under 16
In terms of child poverty among boys under 16, the demographic groups most similar to Thais are Chinese (11.9%, a difference of 1.6%), Immigrants from Hong Kong (12.3%, a difference of 4.9%), Filipino (11.1%, a difference of 5.1%), Immigrants from Taiwan (11.0%, a difference of 5.9%), and Iranian (12.4%, a difference of 6.6%).
| Demographics | Rating | Rank | Child Poverty Among Boys Under 16 |
| Immigrants | India | 100.0 /100 | #1 | Exceptional 10.9% |
| Immigrants | Taiwan | 100.0 /100 | #2 | Exceptional 11.0% |
| Filipinos | 100.0 /100 | #3 | Exceptional 11.1% |
| Thais | 100.0 /100 | #4 | Exceptional 11.7% |
| Chinese | 100.0 /100 | #5 | Exceptional 11.9% |
| Immigrants | Hong Kong | 100.0 /100 | #6 | Exceptional 12.3% |
| Iranians | 100.0 /100 | #7 | Exceptional 12.4% |
| Immigrants | Singapore | 100.0 /100 | #8 | Exceptional 12.5% |
| Immigrants | Iran | 100.0 /100 | #9 | Exceptional 12.5% |
| Bhutanese | 100.0 /100 | #10 | Exceptional 12.6% |
| Immigrants | South Central Asia | 100.0 /100 | #11 | Exceptional 12.7% |
| Burmese | 99.9 /100 | #12 | Exceptional 13.0% |
| Immigrants | Korea | 99.9 /100 | #13 | Exceptional 13.0% |
| Immigrants | Ireland | 99.9 /100 | #14 | Exceptional 13.1% |
| Immigrants | Japan | 99.9 /100 | #15 | Exceptional 13.1% |