Burmese vs Immigrants from Guyana Child Poverty Among Boys Under 16
COMPARE
Burmese
Immigrants from Guyana
Child Poverty Among Boys Under 16
Child Poverty Among Boys Under 16 Comparison
Burmese
Immigrants from Guyana
13.0%
CHILD POVERTY AMONG BOYS UNDER 16
99.9/ 100
METRIC RATING
12th/ 347
METRIC RANK
19.5%
CHILD POVERTY AMONG BOYS UNDER 16
0.1/ 100
METRIC RATING
262nd/ 347
METRIC RANK
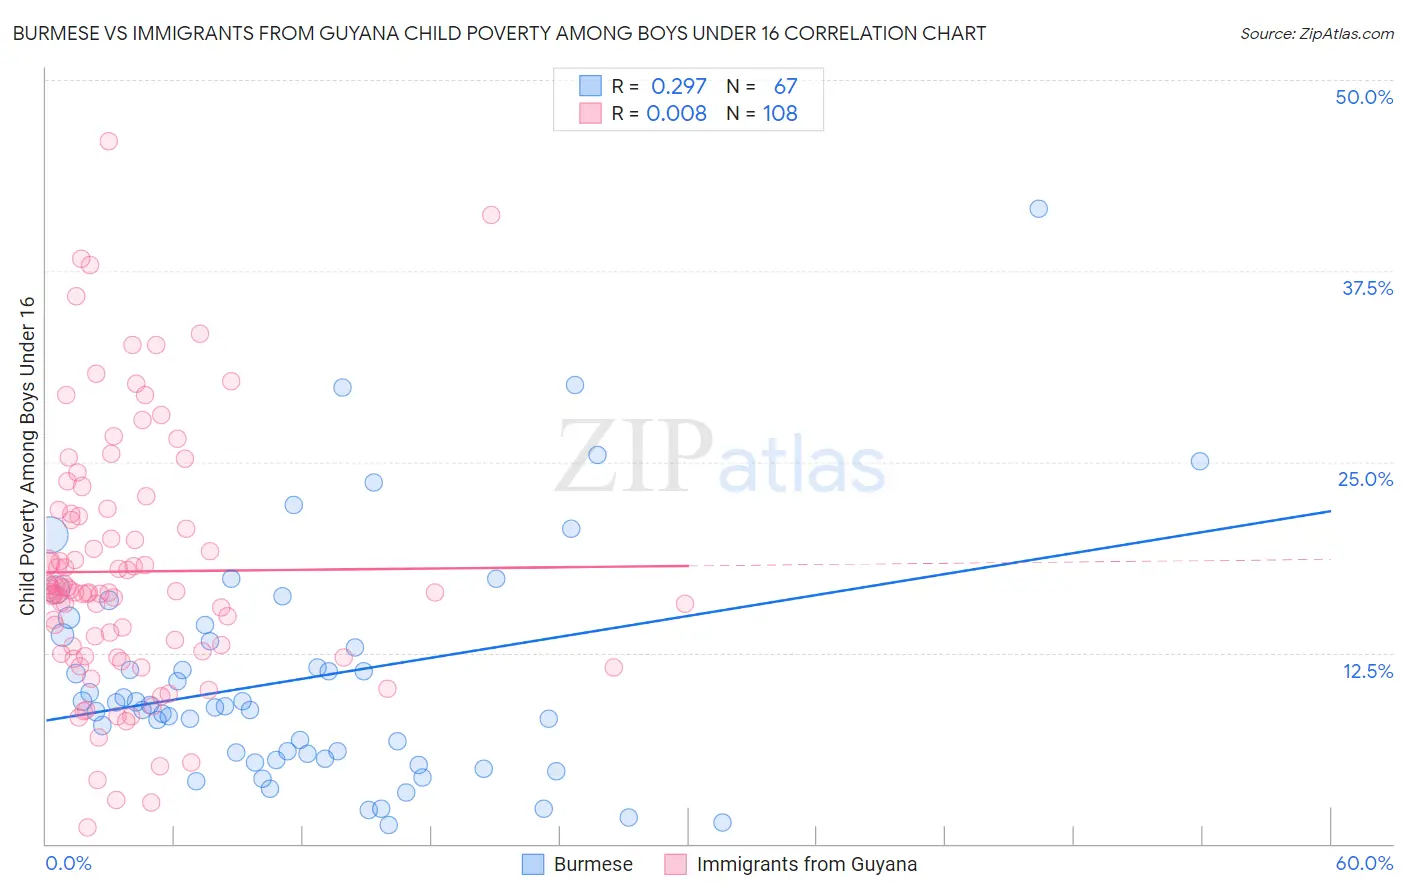
Burmese vs Immigrants from Guyana Child Poverty Among Boys Under 16 Correlation Chart
The statistical analysis conducted on geographies consisting of 454,977,536 people shows a weak positive correlation between the proportion of Burmese and poverty level among boys under the age of 16 in the United States with a correlation coefficient (R) of 0.297 and weighted average of 13.0%. Similarly, the statistical analysis conducted on geographies consisting of 181,993,075 people shows no correlation between the proportion of Immigrants from Guyana and poverty level among boys under the age of 16 in the United States with a correlation coefficient (R) of 0.008 and weighted average of 19.5%, a difference of 50.1%.
Child Poverty Among Boys Under 16 Correlation Summary
| Measurement | Burmese | Immigrants from Guyana |
| Minimum | 1.2% | 1.0% |
| Maximum | 41.5% | 46.0% |
| Range | 40.3% | 45.0% |
| Mean | 10.9% | 17.8% |
| Median | 9.0% | 16.5% |
| Interquartile 25% (IQ1) | 5.6% | 12.4% |
| Interquartile 75% (IQ3) | 13.7% | 21.5% |
| Interquartile Range (IQR) | 8.1% | 9.1% |
| Standard Deviation (Sample) | 7.7% | 8.4% |
| Standard Deviation (Population) | 7.6% | 8.3% |
Similar Demographics by Child Poverty Among Boys Under 16
Demographics Similar to Burmese by Child Poverty Among Boys Under 16
In terms of child poverty among boys under 16, the demographic groups most similar to Burmese are Immigrants from Korea (13.0%, a difference of 0.50%), Immigrants from Ireland (13.1%, a difference of 1.2%), Immigrants from Japan (13.1%, a difference of 1.3%), Maltese (13.2%, a difference of 1.6%), and Norwegian (13.2%, a difference of 1.7%).
| Demographics | Rating | Rank | Child Poverty Among Boys Under 16 |
| Chinese | 100.0 /100 | #5 | Exceptional 11.9% |
| Immigrants | Hong Kong | 100.0 /100 | #6 | Exceptional 12.3% |
| Iranians | 100.0 /100 | #7 | Exceptional 12.4% |
| Immigrants | Singapore | 100.0 /100 | #8 | Exceptional 12.5% |
| Immigrants | Iran | 100.0 /100 | #9 | Exceptional 12.5% |
| Bhutanese | 100.0 /100 | #10 | Exceptional 12.6% |
| Immigrants | South Central Asia | 100.0 /100 | #11 | Exceptional 12.7% |
| Burmese | 99.9 /100 | #12 | Exceptional 13.0% |
| Immigrants | Korea | 99.9 /100 | #13 | Exceptional 13.0% |
| Immigrants | Ireland | 99.9 /100 | #14 | Exceptional 13.1% |
| Immigrants | Japan | 99.9 /100 | #15 | Exceptional 13.1% |
| Maltese | 99.9 /100 | #16 | Exceptional 13.2% |
| Norwegians | 99.9 /100 | #17 | Exceptional 13.2% |
| Bulgarians | 99.9 /100 | #18 | Exceptional 13.3% |
| Bolivians | 99.9 /100 | #19 | Exceptional 13.3% |
Demographics Similar to Immigrants from Guyana by Child Poverty Among Boys Under 16
In terms of child poverty among boys under 16, the demographic groups most similar to Immigrants from Guyana are Ottawa (19.5%, a difference of 0.31%), Immigrants from Ghana (19.4%, a difference of 0.32%), Shoshone (19.4%, a difference of 0.34%), Spanish American (19.4%, a difference of 0.44%), and Potawatomi (19.4%, a difference of 0.46%).
| Demographics | Rating | Rank | Child Poverty Among Boys Under 16 |
| Ecuadorians | 0.2 /100 | #255 | Tragic 19.3% |
| Immigrants | Liberia | 0.2 /100 | #256 | Tragic 19.3% |
| Mexican American Indians | 0.2 /100 | #257 | Tragic 19.4% |
| Potawatomi | 0.2 /100 | #258 | Tragic 19.4% |
| Spanish Americans | 0.2 /100 | #259 | Tragic 19.4% |
| Shoshone | 0.2 /100 | #260 | Tragic 19.4% |
| Immigrants | Ghana | 0.2 /100 | #261 | Tragic 19.4% |
| Immigrants | Guyana | 0.1 /100 | #262 | Tragic 19.5% |
| Ottawa | 0.1 /100 | #263 | Tragic 19.5% |
| Iroquois | 0.1 /100 | #264 | Tragic 19.6% |
| Guyanese | 0.1 /100 | #265 | Tragic 19.6% |
| Immigrants | El Salvador | 0.1 /100 | #266 | Tragic 19.6% |
| Vietnamese | 0.1 /100 | #267 | Tragic 19.6% |
| Spanish American Indians | 0.1 /100 | #268 | Tragic 19.6% |
| Immigrants | Cabo Verde | 0.1 /100 | #269 | Tragic 19.7% |