Immigrants from the Azores vs Immigrants from Guyana Child Poverty Among Boys Under 16
COMPARE
Immigrants from the Azores
Immigrants from Guyana
Child Poverty Among Boys Under 16
Child Poverty Among Boys Under 16 Comparison
Immigrants from the Azores
Immigrants from Guyana
18.9%
CHILD POVERTY AMONG BOYS UNDER 16
0.4/ 100
METRIC RATING
243rd/ 347
METRIC RANK
19.5%
CHILD POVERTY AMONG BOYS UNDER 16
0.1/ 100
METRIC RATING
262nd/ 347
METRIC RANK
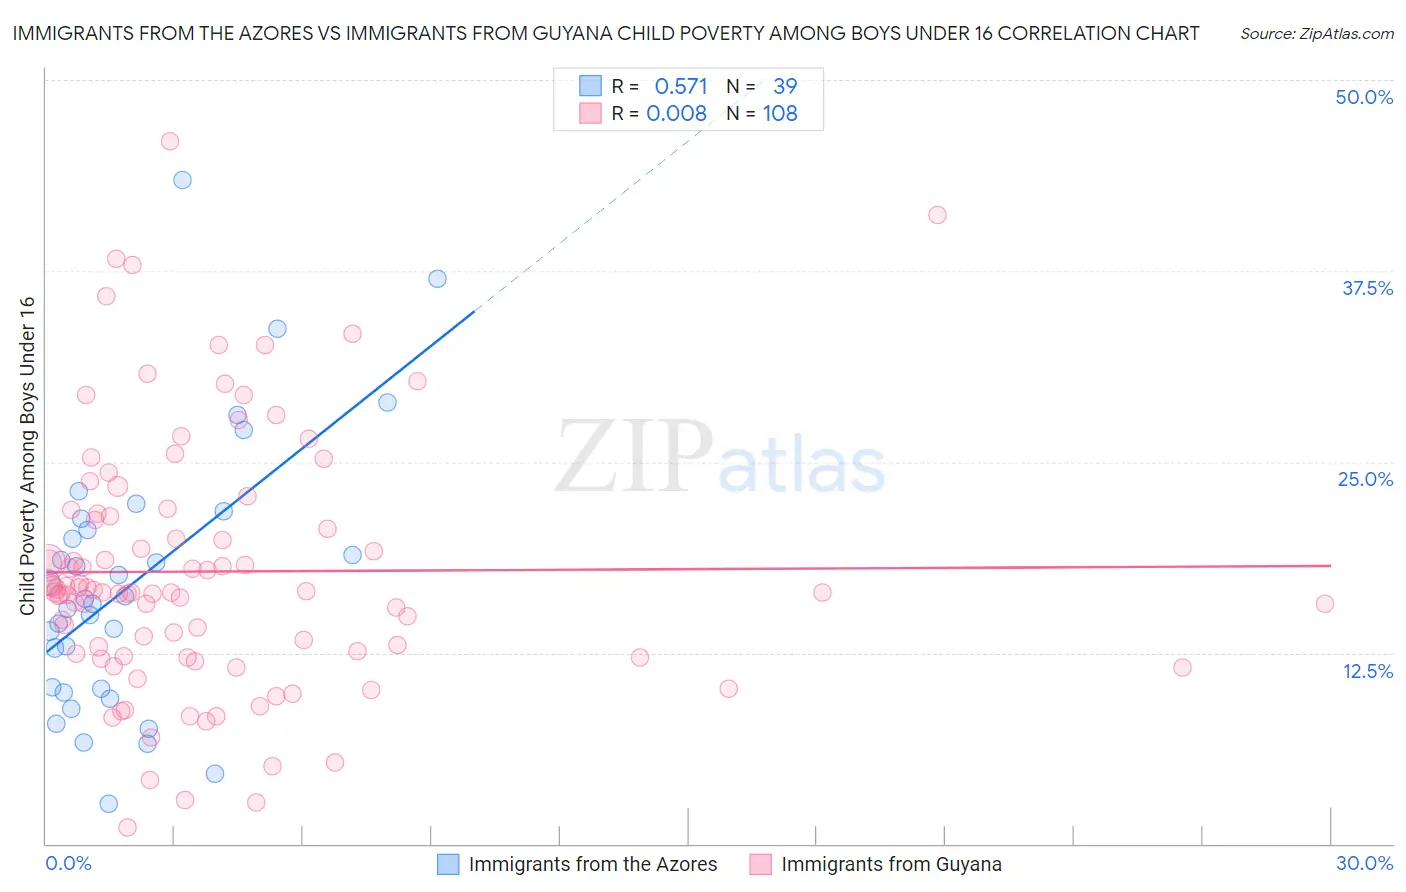
Immigrants from the Azores vs Immigrants from Guyana Child Poverty Among Boys Under 16 Correlation Chart
The statistical analysis conducted on geographies consisting of 45,891,660 people shows a substantial positive correlation between the proportion of Immigrants from the Azores and poverty level among boys under the age of 16 in the United States with a correlation coefficient (R) of 0.571 and weighted average of 18.9%. Similarly, the statistical analysis conducted on geographies consisting of 181,993,075 people shows no correlation between the proportion of Immigrants from Guyana and poverty level among boys under the age of 16 in the United States with a correlation coefficient (R) of 0.008 and weighted average of 19.5%, a difference of 2.8%.
Child Poverty Among Boys Under 16 Correlation Summary
| Measurement | Immigrants from the Azores | Immigrants from Guyana |
| Minimum | 2.6% | 1.0% |
| Maximum | 43.4% | 46.0% |
| Range | 40.8% | 45.0% |
| Mean | 17.1% | 17.8% |
| Median | 16.1% | 16.5% |
| Interquartile 25% (IQ1) | 10.2% | 12.4% |
| Interquartile 75% (IQ3) | 21.3% | 21.5% |
| Interquartile Range (IQR) | 11.1% | 9.1% |
| Standard Deviation (Sample) | 8.8% | 8.4% |
| Standard Deviation (Population) | 8.7% | 8.3% |
Demographics Similar to Immigrants from the Azores and Immigrants from Guyana by Child Poverty Among Boys Under 16
In terms of child poverty among boys under 16, the demographic groups most similar to Immigrants from the Azores are Immigrants from Middle Africa (18.9%, a difference of 0.010%), Cree (19.0%, a difference of 0.14%), Ghanaian (18.9%, a difference of 0.34%), Immigrants from Nicaragua (19.0%, a difference of 0.34%), and Immigrants from Trinidad and Tobago (19.0%, a difference of 0.46%). Similarly, the demographic groups most similar to Immigrants from Guyana are Immigrants from Ghana (19.4%, a difference of 0.32%), Shoshone (19.4%, a difference of 0.34%), Spanish American (19.4%, a difference of 0.44%), Potawatomi (19.4%, a difference of 0.46%), and Mexican American Indian (19.4%, a difference of 0.47%).
| Demographics | Rating | Rank | Child Poverty Among Boys Under 16 |
| Ghanaians | 0.5 /100 | #242 | Tragic 18.9% |
| Immigrants | Azores | 0.4 /100 | #243 | Tragic 18.9% |
| Immigrants | Middle Africa | 0.4 /100 | #244 | Tragic 18.9% |
| Cree | 0.4 /100 | #245 | Tragic 19.0% |
| Immigrants | Nicaragua | 0.4 /100 | #246 | Tragic 19.0% |
| Immigrants | Trinidad and Tobago | 0.3 /100 | #247 | Tragic 19.0% |
| Salvadorans | 0.3 /100 | #248 | Tragic 19.0% |
| Alsatians | 0.3 /100 | #249 | Tragic 19.1% |
| Immigrants | Burma/Myanmar | 0.2 /100 | #250 | Tragic 19.2% |
| French American Indians | 0.2 /100 | #251 | Tragic 19.2% |
| Immigrants | Western Africa | 0.2 /100 | #252 | Tragic 19.3% |
| Liberians | 0.2 /100 | #253 | Tragic 19.3% |
| Trinidadians and Tobagonians | 0.2 /100 | #254 | Tragic 19.3% |
| Ecuadorians | 0.2 /100 | #255 | Tragic 19.3% |
| Immigrants | Liberia | 0.2 /100 | #256 | Tragic 19.3% |
| Mexican American Indians | 0.2 /100 | #257 | Tragic 19.4% |
| Potawatomi | 0.2 /100 | #258 | Tragic 19.4% |
| Spanish Americans | 0.2 /100 | #259 | Tragic 19.4% |
| Shoshone | 0.2 /100 | #260 | Tragic 19.4% |
| Immigrants | Ghana | 0.2 /100 | #261 | Tragic 19.4% |
| Immigrants | Guyana | 0.1 /100 | #262 | Tragic 19.5% |