Cajun vs Immigrants from Ghana Receiving Food Stamps
COMPARE
Cajun
Immigrants from Ghana
Receiving Food Stamps
Receiving Food Stamps Comparison
Cajuns
Immigrants from Ghana
13.7%
RECEIVING FOOD STAMPS
0.9/ 100
METRIC RATING
244th/ 347
METRIC RANK
14.1%
RECEIVING FOOD STAMPS
0.3/ 100
METRIC RATING
258th/ 347
METRIC RANK
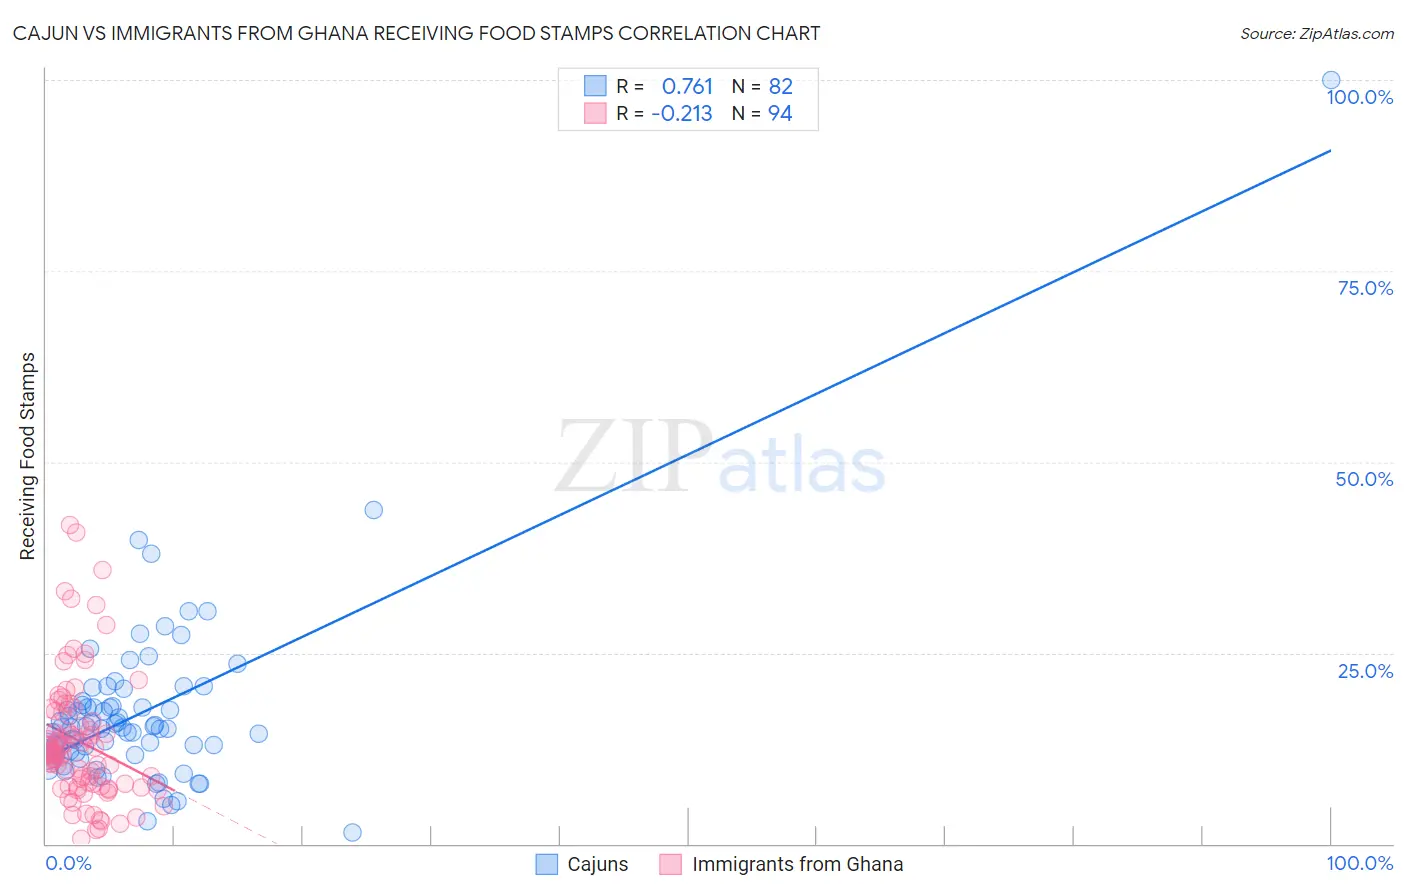
Cajun vs Immigrants from Ghana Receiving Food Stamps Correlation Chart
The statistical analysis conducted on geographies consisting of 149,551,160 people shows a strong positive correlation between the proportion of Cajuns and percentage of population receiving government assistance and/or food stamps in the United States with a correlation coefficient (R) of 0.761 and weighted average of 13.7%. Similarly, the statistical analysis conducted on geographies consisting of 199,399,375 people shows a weak negative correlation between the proportion of Immigrants from Ghana and percentage of population receiving government assistance and/or food stamps in the United States with a correlation coefficient (R) of -0.213 and weighted average of 14.1%, a difference of 3.2%.
Receiving Food Stamps Correlation Summary
| Measurement | Cajun | Immigrants from Ghana |
| Minimum | 1.4% | 0.70% |
| Maximum | 100.0% | 41.8% |
| Range | 98.6% | 41.1% |
| Mean | 17.2% | 13.4% |
| Median | 15.2% | 11.9% |
| Interquartile 25% (IQ1) | 12.0% | 7.5% |
| Interquartile 75% (IQ3) | 18.2% | 17.1% |
| Interquartile Range (IQR) | 6.3% | 9.6% |
| Standard Deviation (Sample) | 11.9% | 8.3% |
| Standard Deviation (Population) | 11.9% | 8.3% |
Demographics Similar to Cajuns and Immigrants from Ghana by Receiving Food Stamps
In terms of receiving food stamps, the demographic groups most similar to Cajuns are Immigrants from Somalia (13.7%, a difference of 0.040%), Somali (13.7%, a difference of 0.16%), Cree (13.7%, a difference of 0.28%), Immigrants from Panama (13.6%, a difference of 0.35%), and Choctaw (13.6%, a difference of 0.54%). Similarly, the demographic groups most similar to Immigrants from Ghana are Arapaho (14.1%, a difference of 0.080%), Creek (14.1%, a difference of 0.12%), Japanese (14.1%, a difference of 0.18%), Subsaharan African (14.1%, a difference of 0.20%), and Marshallese (14.1%, a difference of 0.21%).
| Demographics | Rating | Rank | Receiving Food Stamps |
| Choctaw | 1.0 /100 | #241 | Tragic 13.6% |
| Immigrants | Panama | 1.0 /100 | #242 | Tragic 13.6% |
| Somalis | 0.9 /100 | #243 | Tragic 13.7% |
| Cajuns | 0.9 /100 | #244 | Tragic 13.7% |
| Immigrants | Somalia | 0.9 /100 | #245 | Tragic 13.7% |
| Cree | 0.8 /100 | #246 | Tragic 13.7% |
| Mexican American Indians | 0.7 /100 | #247 | Tragic 13.8% |
| Immigrants | Laos | 0.7 /100 | #248 | Tragic 13.8% |
| Indonesians | 0.6 /100 | #249 | Tragic 13.9% |
| Immigrants | Cambodia | 0.5 /100 | #250 | Tragic 13.9% |
| Yaqui | 0.5 /100 | #251 | Tragic 13.9% |
| Ghanaians | 0.5 /100 | #252 | Tragic 14.0% |
| Spanish Americans | 0.4 /100 | #253 | Tragic 14.0% |
| Marshallese | 0.3 /100 | #254 | Tragic 14.1% |
| Sub-Saharan Africans | 0.3 /100 | #255 | Tragic 14.1% |
| Japanese | 0.3 /100 | #256 | Tragic 14.1% |
| Arapaho | 0.3 /100 | #257 | Tragic 14.1% |
| Immigrants | Ghana | 0.3 /100 | #258 | Tragic 14.1% |
| Creek | 0.3 /100 | #259 | Tragic 14.1% |
| Central Americans | 0.3 /100 | #260 | Tragic 14.1% |
| Immigrants | Congo | 0.3 /100 | #261 | Tragic 14.1% |