Immigrants from St. Vincent and the Grenadines vs Latvian Seniors Poverty Over the Age of 65
COMPARE
Immigrants from St. Vincent and the Grenadines
Latvian
Seniors Poverty Over the Age of 65
Seniors Poverty Over the Age of 65 Comparison
Immigrants from St. Vincent and the Grenadines
Latvians
15.5%
SENIORS POVERTY OVER THE AGE OF 65
0.0/ 100
METRIC RATING
330th/ 347
METRIC RANK
9.5%
SENIORS POVERTY OVER THE AGE OF 65
99.8/ 100
METRIC RATING
35th/ 347
METRIC RANK
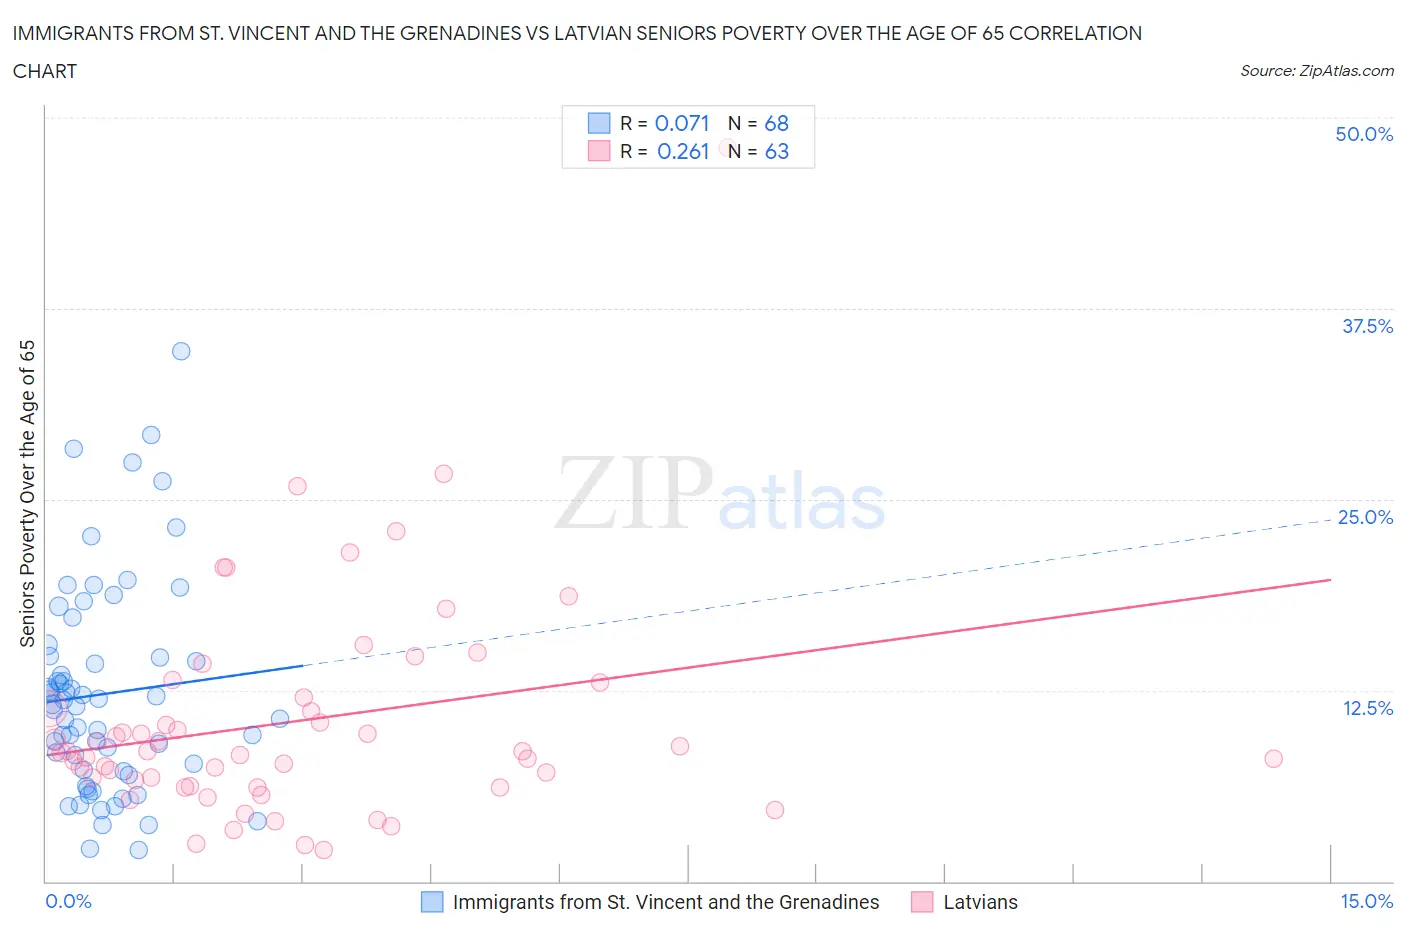
Immigrants from St. Vincent and the Grenadines vs Latvian Seniors Poverty Over the Age of 65 Correlation Chart
The statistical analysis conducted on geographies consisting of 56,115,255 people shows a slight positive correlation between the proportion of Immigrants from St. Vincent and the Grenadines and poverty level among seniors over the age of 65 in the United States with a correlation coefficient (R) of 0.071 and weighted average of 15.5%. Similarly, the statistical analysis conducted on geographies consisting of 220,200,877 people shows a weak positive correlation between the proportion of Latvians and poverty level among seniors over the age of 65 in the United States with a correlation coefficient (R) of 0.261 and weighted average of 9.5%, a difference of 64.1%.
Seniors Poverty Over the Age of 65 Correlation Summary
| Measurement | Immigrants from St. Vincent and the Grenadines | Latvian |
| Minimum | 2.1% | 2.0% |
| Maximum | 34.7% | 48.0% |
| Range | 32.6% | 46.0% |
| Mean | 12.3% | 10.5% |
| Median | 11.5% | 8.5% |
| Interquartile 25% (IQ1) | 7.2% | 6.3% |
| Interquartile 75% (IQ3) | 14.7% | 12.0% |
| Interquartile Range (IQR) | 7.4% | 5.7% |
| Standard Deviation (Sample) | 6.9% | 7.4% |
| Standard Deviation (Population) | 6.8% | 7.3% |
Similar Demographics by Seniors Poverty Over the Age of 65
Demographics Similar to Immigrants from St. Vincent and the Grenadines by Seniors Poverty Over the Age of 65
In terms of seniors poverty over the age of 65, the demographic groups most similar to Immigrants from St. Vincent and the Grenadines are Immigrants from Dominica (15.5%, a difference of 0.30%), British West Indian (15.6%, a difference of 0.51%), Sioux (15.3%, a difference of 1.4%), Immigrants from Grenada (15.8%, a difference of 1.9%), and Crow (15.2%, a difference of 1.9%).
| Demographics | Rating | Rank | Seniors Poverty Over the Age of 65 |
| Yakama | 0.0 /100 | #323 | Tragic 14.8% |
| Nicaraguans | 0.0 /100 | #324 | Tragic 15.0% |
| Central American Indians | 0.0 /100 | #325 | Tragic 15.1% |
| Immigrants | Armenia | 0.0 /100 | #326 | Tragic 15.2% |
| Crow | 0.0 /100 | #327 | Tragic 15.2% |
| Sioux | 0.0 /100 | #328 | Tragic 15.3% |
| Immigrants | Dominica | 0.0 /100 | #329 | Tragic 15.5% |
| Immigrants | St. Vincent and the Grenadines | 0.0 /100 | #330 | Tragic 15.5% |
| British West Indians | 0.0 /100 | #331 | Tragic 15.6% |
| Immigrants | Grenada | 0.0 /100 | #332 | Tragic 15.8% |
| Immigrants | Yemen | 0.0 /100 | #333 | Tragic 15.9% |
| Immigrants | Nicaragua | 0.0 /100 | #334 | Tragic 15.9% |
| Cubans | 0.0 /100 | #335 | Tragic 16.1% |
| Immigrants | Cabo Verde | 0.0 /100 | #336 | Tragic 16.2% |
| Immigrants | Caribbean | 0.0 /100 | #337 | Tragic 16.5% |
Demographics Similar to Latvians by Seniors Poverty Over the Age of 65
In terms of seniors poverty over the age of 65, the demographic groups most similar to Latvians are Czechoslovakian (9.5%, a difference of 0.050%), British (9.4%, a difference of 0.38%), Native Hawaiian (9.4%, a difference of 0.48%), Northern European (9.4%, a difference of 0.50%), and Scotch-Irish (9.5%, a difference of 0.55%).
| Demographics | Rating | Rank | Seniors Poverty Over the Age of 65 |
| Tongans | 99.9 /100 | #28 | Exceptional 9.3% |
| Bhutanese | 99.9 /100 | #29 | Exceptional 9.3% |
| Menominee | 99.8 /100 | #30 | Exceptional 9.4% |
| Finns | 99.8 /100 | #31 | Exceptional 9.4% |
| Northern Europeans | 99.8 /100 | #32 | Exceptional 9.4% |
| Native Hawaiians | 99.8 /100 | #33 | Exceptional 9.4% |
| British | 99.8 /100 | #34 | Exceptional 9.4% |
| Latvians | 99.8 /100 | #35 | Exceptional 9.5% |
| Czechoslovakians | 99.8 /100 | #36 | Exceptional 9.5% |
| Scotch-Irish | 99.7 /100 | #37 | Exceptional 9.5% |
| Belgians | 99.7 /100 | #38 | Exceptional 9.5% |
| Greeks | 99.6 /100 | #39 | Exceptional 9.6% |
| Assyrians/Chaldeans/Syriacs | 99.6 /100 | #40 | Exceptional 9.6% |
| Immigrants | North Macedonia | 99.6 /100 | #41 | Exceptional 9.6% |
| Zimbabweans | 99.6 /100 | #42 | Exceptional 9.6% |