Immigrants from Philippines vs Latvian Seniors Poverty Over the Age of 65
COMPARE
Immigrants from Philippines
Latvian
Seniors Poverty Over the Age of 65
Seniors Poverty Over the Age of 65 Comparison
Immigrants from Philippines
Latvians
10.4%
SENIORS POVERTY OVER THE AGE OF 65
89.4/ 100
METRIC RATING
125th/ 347
METRIC RANK
9.5%
SENIORS POVERTY OVER THE AGE OF 65
99.8/ 100
METRIC RATING
35th/ 347
METRIC RANK
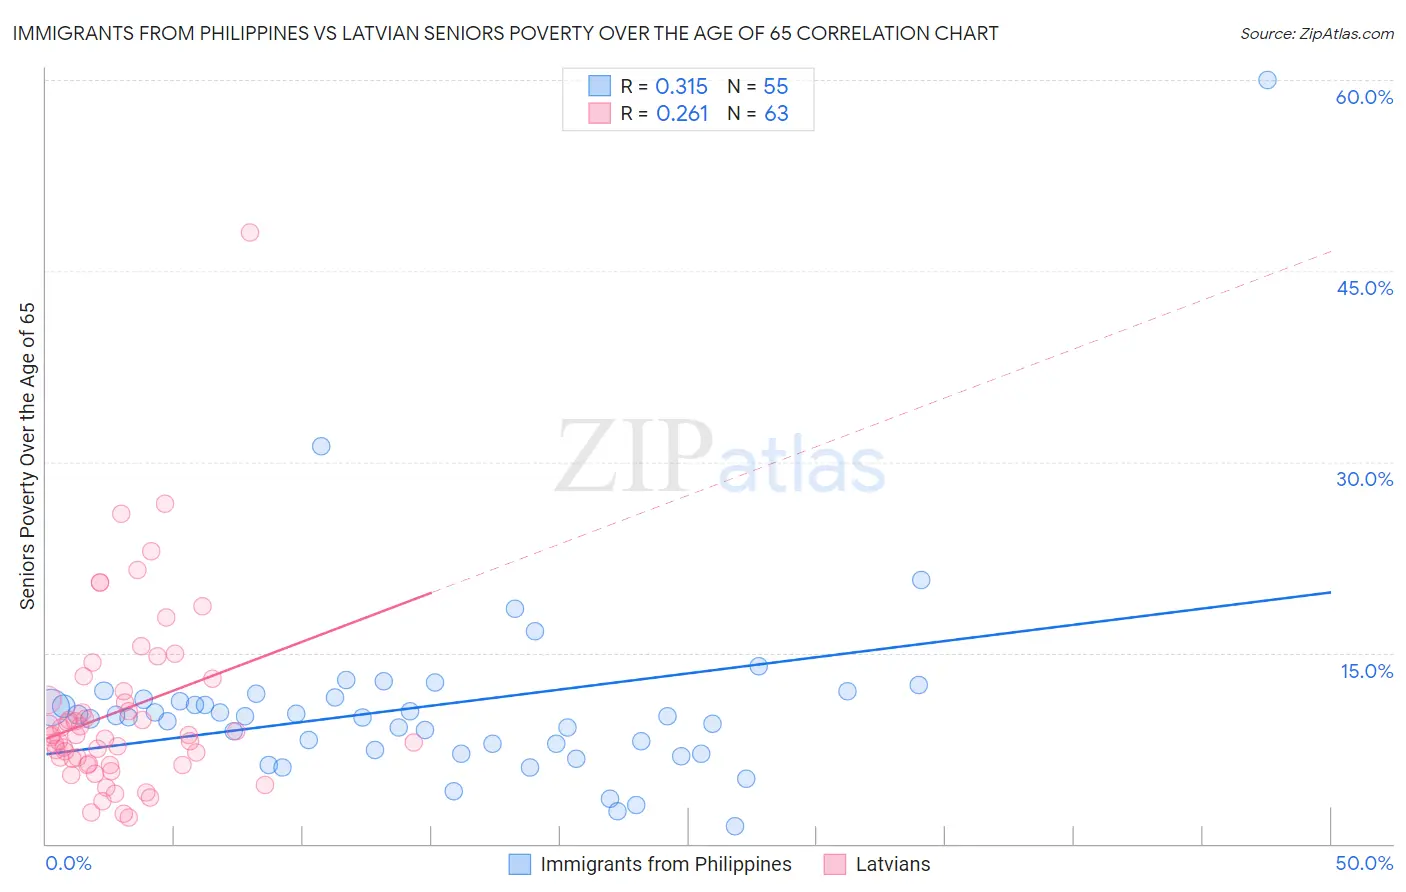
Immigrants from Philippines vs Latvian Seniors Poverty Over the Age of 65 Correlation Chart
The statistical analysis conducted on geographies consisting of 469,103,257 people shows a mild positive correlation between the proportion of Immigrants from Philippines and poverty level among seniors over the age of 65 in the United States with a correlation coefficient (R) of 0.315 and weighted average of 10.4%. Similarly, the statistical analysis conducted on geographies consisting of 220,200,877 people shows a weak positive correlation between the proportion of Latvians and poverty level among seniors over the age of 65 in the United States with a correlation coefficient (R) of 0.261 and weighted average of 9.5%, a difference of 10.2%.
Seniors Poverty Over the Age of 65 Correlation Summary
| Measurement | Immigrants from Philippines | Latvian |
| Minimum | 1.3% | 2.0% |
| Maximum | 60.0% | 48.0% |
| Range | 58.7% | 46.0% |
| Mean | 10.8% | 10.5% |
| Median | 10.0% | 8.5% |
| Interquartile 25% (IQ1) | 7.4% | 6.3% |
| Interquartile 75% (IQ3) | 11.5% | 12.0% |
| Interquartile Range (IQR) | 4.1% | 5.7% |
| Standard Deviation (Sample) | 8.2% | 7.4% |
| Standard Deviation (Population) | 8.1% | 7.3% |
Similar Demographics by Seniors Poverty Over the Age of 65
Demographics Similar to Immigrants from Philippines by Seniors Poverty Over the Age of 65
In terms of seniors poverty over the age of 65, the demographic groups most similar to Immigrants from Philippines are Immigrants from Hungary (10.4%, a difference of 0.070%), Cambodian (10.4%, a difference of 0.070%), Asian (10.4%, a difference of 0.14%), Hmong (10.4%, a difference of 0.17%), and Ottawa (10.4%, a difference of 0.20%).
| Demographics | Rating | Rank | Seniors Poverty Over the Age of 65 |
| Okinawans | 91.7 /100 | #118 | Exceptional 10.4% |
| Immigrants | Western Europe | 91.1 /100 | #119 | Exceptional 10.4% |
| Immigrants | Bosnia and Herzegovina | 90.8 /100 | #120 | Exceptional 10.4% |
| Immigrants | Iraq | 90.7 /100 | #121 | Exceptional 10.4% |
| Immigrants | Moldova | 90.7 /100 | #122 | Exceptional 10.4% |
| Hmong | 90.0 /100 | #123 | Exceptional 10.4% |
| Asians | 89.9 /100 | #124 | Excellent 10.4% |
| Immigrants | Philippines | 89.4 /100 | #125 | Excellent 10.4% |
| Immigrants | Hungary | 89.1 /100 | #126 | Excellent 10.4% |
| Cambodians | 89.1 /100 | #127 | Excellent 10.4% |
| Ottawa | 88.5 /100 | #128 | Excellent 10.4% |
| Immigrants | Iran | 88.4 /100 | #129 | Excellent 10.4% |
| Immigrants | Oceania | 88.4 /100 | #130 | Excellent 10.4% |
| Egyptians | 87.8 /100 | #131 | Excellent 10.5% |
| Immigrants | Turkey | 87.7 /100 | #132 | Excellent 10.5% |
Demographics Similar to Latvians by Seniors Poverty Over the Age of 65
In terms of seniors poverty over the age of 65, the demographic groups most similar to Latvians are Czechoslovakian (9.5%, a difference of 0.050%), British (9.4%, a difference of 0.38%), Native Hawaiian (9.4%, a difference of 0.48%), Northern European (9.4%, a difference of 0.50%), and Scotch-Irish (9.5%, a difference of 0.55%).
| Demographics | Rating | Rank | Seniors Poverty Over the Age of 65 |
| Tongans | 99.9 /100 | #28 | Exceptional 9.3% |
| Bhutanese | 99.9 /100 | #29 | Exceptional 9.3% |
| Menominee | 99.8 /100 | #30 | Exceptional 9.4% |
| Finns | 99.8 /100 | #31 | Exceptional 9.4% |
| Northern Europeans | 99.8 /100 | #32 | Exceptional 9.4% |
| Native Hawaiians | 99.8 /100 | #33 | Exceptional 9.4% |
| British | 99.8 /100 | #34 | Exceptional 9.4% |
| Latvians | 99.8 /100 | #35 | Exceptional 9.5% |
| Czechoslovakians | 99.8 /100 | #36 | Exceptional 9.5% |
| Scotch-Irish | 99.7 /100 | #37 | Exceptional 9.5% |
| Belgians | 99.7 /100 | #38 | Exceptional 9.5% |
| Greeks | 99.6 /100 | #39 | Exceptional 9.6% |
| Assyrians/Chaldeans/Syriacs | 99.6 /100 | #40 | Exceptional 9.6% |
| Immigrants | North Macedonia | 99.6 /100 | #41 | Exceptional 9.6% |
| Zimbabweans | 99.6 /100 | #42 | Exceptional 9.6% |