Immigrants from St. Vincent and the Grenadines vs Latvian Seniors Poverty Over the Age of 75
COMPARE
Immigrants from St. Vincent and the Grenadines
Latvian
Seniors Poverty Over the Age of 75
Seniors Poverty Over the Age of 75 Comparison
Immigrants from St. Vincent and the Grenadines
Latvians
17.5%
SENIORS POVERTY OVER THE AGE OF 75
0.0/ 100
METRIC RATING
332nd/ 347
METRIC RANK
10.8%
SENIORS POVERTY OVER THE AGE OF 75
99.6/ 100
METRIC RATING
37th/ 347
METRIC RANK
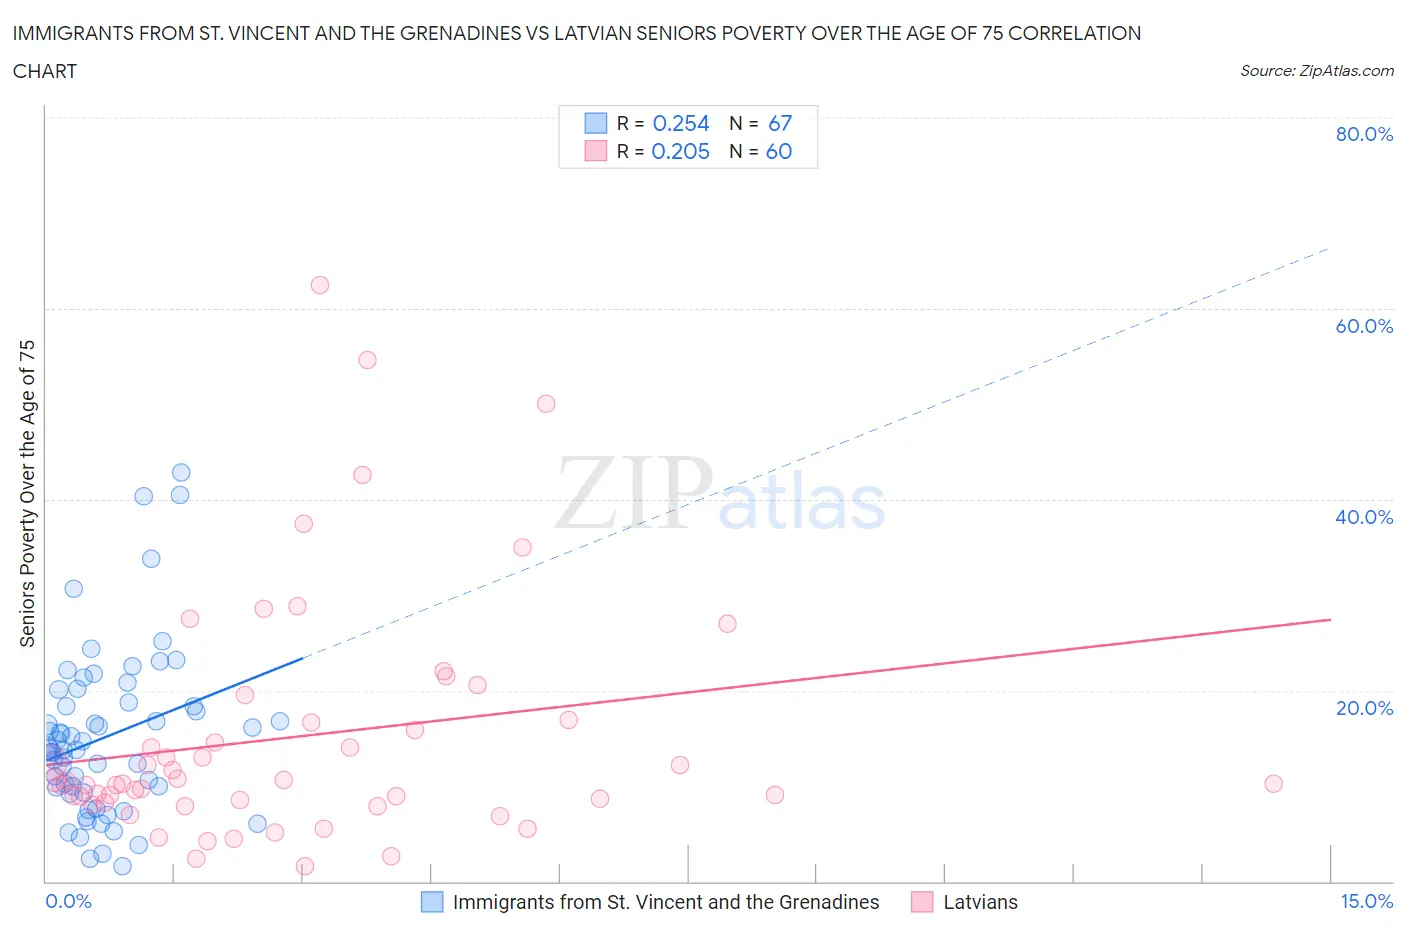
Immigrants from St. Vincent and the Grenadines vs Latvian Seniors Poverty Over the Age of 75 Correlation Chart
The statistical analysis conducted on geographies consisting of 56,047,210 people shows a weak positive correlation between the proportion of Immigrants from St. Vincent and the Grenadines and poverty level among seniors over the age of 75 in the United States with a correlation coefficient (R) of 0.254 and weighted average of 17.5%. Similarly, the statistical analysis conducted on geographies consisting of 219,227,834 people shows a weak positive correlation between the proportion of Latvians and poverty level among seniors over the age of 75 in the United States with a correlation coefficient (R) of 0.205 and weighted average of 10.8%, a difference of 61.7%.
Seniors Poverty Over the Age of 75 Correlation Summary
| Measurement | Immigrants from St. Vincent and the Grenadines | Latvian |
| Minimum | 1.6% | 1.5% |
| Maximum | 42.8% | 62.5% |
| Range | 41.2% | 61.0% |
| Mean | 15.1% | 15.1% |
| Median | 13.9% | 10.4% |
| Interquartile 25% (IQ1) | 9.3% | 8.4% |
| Interquartile 75% (IQ3) | 18.8% | 16.8% |
| Interquartile Range (IQR) | 9.4% | 8.4% |
| Standard Deviation (Sample) | 8.7% | 12.7% |
| Standard Deviation (Population) | 8.7% | 12.6% |
Similar Demographics by Seniors Poverty Over the Age of 75
Demographics Similar to Immigrants from St. Vincent and the Grenadines by Seniors Poverty Over the Age of 75
In terms of seniors poverty over the age of 75, the demographic groups most similar to Immigrants from St. Vincent and the Grenadines are Immigrants from Armenia (17.5%, a difference of 0.26%), Immigrants from Nicaragua (17.6%, a difference of 0.47%), British West Indian (17.4%, a difference of 0.52%), Immigrants from Grenada (17.8%, a difference of 2.0%), and Cuban (18.0%, a difference of 2.6%).
| Demographics | Rating | Rank | Seniors Poverty Over the Age of 75 |
| Nicaraguans | 0.0 /100 | #325 | Tragic 16.6% |
| Pueblo | 0.0 /100 | #326 | Tragic 16.7% |
| Sioux | 0.0 /100 | #327 | Tragic 16.8% |
| Cape Verdeans | 0.0 /100 | #328 | Tragic 16.8% |
| Immigrants | Dominica | 0.0 /100 | #329 | Tragic 17.0% |
| British West Indians | 0.0 /100 | #330 | Tragic 17.4% |
| Immigrants | Armenia | 0.0 /100 | #331 | Tragic 17.5% |
| Immigrants | St. Vincent and the Grenadines | 0.0 /100 | #332 | Tragic 17.5% |
| Immigrants | Nicaragua | 0.0 /100 | #333 | Tragic 17.6% |
| Immigrants | Grenada | 0.0 /100 | #334 | Tragic 17.8% |
| Cubans | 0.0 /100 | #335 | Tragic 18.0% |
| Immigrants | Caribbean | 0.0 /100 | #336 | Tragic 18.2% |
| Yakama | 0.0 /100 | #337 | Tragic 18.3% |
| Immigrants | Cabo Verde | 0.0 /100 | #338 | Tragic 18.5% |
| Hopi | 0.0 /100 | #339 | Tragic 18.9% |
Demographics Similar to Latvians by Seniors Poverty Over the Age of 75
In terms of seniors poverty over the age of 75, the demographic groups most similar to Latvians are Finnish (10.8%, a difference of 0.14%), Scotch-Irish (10.8%, a difference of 0.16%), Luxembourger (10.8%, a difference of 0.21%), Italian (10.8%, a difference of 0.60%), and Puget Sound Salish (10.8%, a difference of 0.65%).
| Demographics | Rating | Rank | Seniors Poverty Over the Age of 75 |
| Swiss | 99.7 /100 | #30 | Exceptional 10.7% |
| Marshallese | 99.7 /100 | #31 | Exceptional 10.7% |
| British | 99.7 /100 | #32 | Exceptional 10.7% |
| Puget Sound Salish | 99.7 /100 | #33 | Exceptional 10.8% |
| Italians | 99.7 /100 | #34 | Exceptional 10.8% |
| Luxembourgers | 99.6 /100 | #35 | Exceptional 10.8% |
| Scotch-Irish | 99.6 /100 | #36 | Exceptional 10.8% |
| Latvians | 99.6 /100 | #37 | Exceptional 10.8% |
| Finns | 99.6 /100 | #38 | Exceptional 10.8% |
| Czechoslovakians | 99.4 /100 | #39 | Exceptional 10.9% |
| Thais | 99.4 /100 | #40 | Exceptional 10.9% |
| Immigrants | Lithuania | 99.2 /100 | #41 | Exceptional 11.0% |
| Austrians | 99.1 /100 | #42 | Exceptional 11.0% |
| Celtics | 99.1 /100 | #43 | Exceptional 11.0% |
| Belgians | 99.1 /100 | #44 | Exceptional 11.0% |