Immigrants from St. Vincent and the Grenadines vs Immigrants from Norway Seniors Poverty Over the Age of 65
COMPARE
Immigrants from St. Vincent and the Grenadines
Immigrants from Norway
Seniors Poverty Over the Age of 65
Seniors Poverty Over the Age of 65 Comparison
Immigrants from St. Vincent and the Grenadines
Immigrants from Norway
15.5%
SENIORS POVERTY OVER THE AGE OF 65
0.0/ 100
METRIC RATING
330th/ 347
METRIC RANK
10.5%
SENIORS POVERTY OVER THE AGE OF 65
86.5/ 100
METRIC RATING
135th/ 347
METRIC RANK
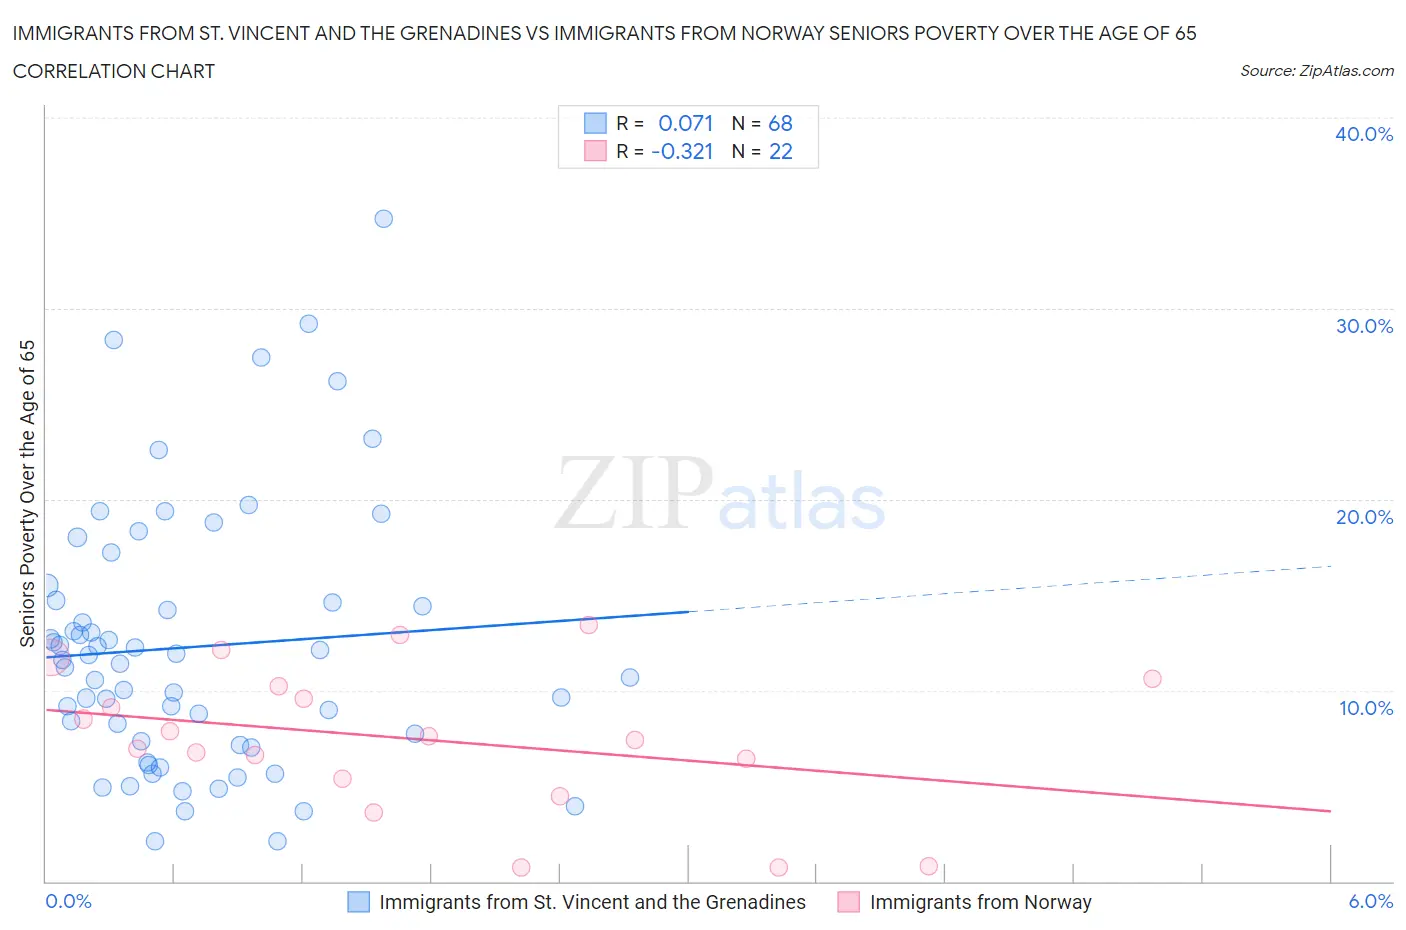
Immigrants from St. Vincent and the Grenadines vs Immigrants from Norway Seniors Poverty Over the Age of 65 Correlation Chart
The statistical analysis conducted on geographies consisting of 56,115,255 people shows a slight positive correlation between the proportion of Immigrants from St. Vincent and the Grenadines and poverty level among seniors over the age of 65 in the United States with a correlation coefficient (R) of 0.071 and weighted average of 15.5%. Similarly, the statistical analysis conducted on geographies consisting of 116,590,861 people shows a mild negative correlation between the proportion of Immigrants from Norway and poverty level among seniors over the age of 65 in the United States with a correlation coefficient (R) of -0.321 and weighted average of 10.5%, a difference of 48.0%.
Seniors Poverty Over the Age of 65 Correlation Summary
| Measurement | Immigrants from St. Vincent and the Grenadines | Immigrants from Norway |
| Minimum | 2.1% | 0.71% |
| Maximum | 34.7% | 13.4% |
| Range | 32.6% | 12.7% |
| Mean | 12.3% | 7.4% |
| Median | 11.5% | 7.5% |
| Interquartile 25% (IQ1) | 7.2% | 5.4% |
| Interquartile 75% (IQ3) | 14.7% | 10.2% |
| Interquartile Range (IQR) | 7.4% | 4.9% |
| Standard Deviation (Sample) | 6.9% | 3.8% |
| Standard Deviation (Population) | 6.8% | 3.7% |
Similar Demographics by Seniors Poverty Over the Age of 65
Demographics Similar to Immigrants from St. Vincent and the Grenadines by Seniors Poverty Over the Age of 65
In terms of seniors poverty over the age of 65, the demographic groups most similar to Immigrants from St. Vincent and the Grenadines are Immigrants from Dominica (15.5%, a difference of 0.30%), British West Indian (15.6%, a difference of 0.51%), Sioux (15.3%, a difference of 1.4%), Immigrants from Grenada (15.8%, a difference of 1.9%), and Crow (15.2%, a difference of 1.9%).
| Demographics | Rating | Rank | Seniors Poverty Over the Age of 65 |
| Yakama | 0.0 /100 | #323 | Tragic 14.8% |
| Nicaraguans | 0.0 /100 | #324 | Tragic 15.0% |
| Central American Indians | 0.0 /100 | #325 | Tragic 15.1% |
| Immigrants | Armenia | 0.0 /100 | #326 | Tragic 15.2% |
| Crow | 0.0 /100 | #327 | Tragic 15.2% |
| Sioux | 0.0 /100 | #328 | Tragic 15.3% |
| Immigrants | Dominica | 0.0 /100 | #329 | Tragic 15.5% |
| Immigrants | St. Vincent and the Grenadines | 0.0 /100 | #330 | Tragic 15.5% |
| British West Indians | 0.0 /100 | #331 | Tragic 15.6% |
| Immigrants | Grenada | 0.0 /100 | #332 | Tragic 15.8% |
| Immigrants | Yemen | 0.0 /100 | #333 | Tragic 15.9% |
| Immigrants | Nicaragua | 0.0 /100 | #334 | Tragic 15.9% |
| Cubans | 0.0 /100 | #335 | Tragic 16.1% |
| Immigrants | Cabo Verde | 0.0 /100 | #336 | Tragic 16.2% |
| Immigrants | Caribbean | 0.0 /100 | #337 | Tragic 16.5% |
Demographics Similar to Immigrants from Norway by Seniors Poverty Over the Age of 65
In terms of seniors poverty over the age of 65, the demographic groups most similar to Immigrants from Norway are Immigrants from Serbia (10.5%, a difference of 0.010%), Sierra Leonean (10.5%, a difference of 0.060%), Guamanian/Chamorro (10.5%, a difference of 0.22%), Immigrants from Turkey (10.5%, a difference of 0.25%), and Egyptian (10.5%, a difference of 0.27%).
| Demographics | Rating | Rank | Seniors Poverty Over the Age of 65 |
| Ottawa | 88.5 /100 | #128 | Excellent 10.4% |
| Immigrants | Iran | 88.4 /100 | #129 | Excellent 10.4% |
| Immigrants | Oceania | 88.4 /100 | #130 | Excellent 10.4% |
| Egyptians | 87.8 /100 | #131 | Excellent 10.5% |
| Immigrants | Turkey | 87.7 /100 | #132 | Excellent 10.5% |
| Guamanians/Chamorros | 87.5 /100 | #133 | Excellent 10.5% |
| Sierra Leoneans | 86.8 /100 | #134 | Excellent 10.5% |
| Immigrants | Norway | 86.5 /100 | #135 | Excellent 10.5% |
| Immigrants | Serbia | 86.4 /100 | #136 | Excellent 10.5% |
| Immigrants | Australia | 85.1 /100 | #137 | Excellent 10.5% |
| Immigrants | Latvia | 84.7 /100 | #138 | Excellent 10.5% |
| Portuguese | 84.1 /100 | #139 | Excellent 10.5% |
| Immigrants | Kenya | 83.4 /100 | #140 | Excellent 10.5% |
| Immigrants | Europe | 83.3 /100 | #141 | Excellent 10.5% |
| Osage | 82.8 /100 | #142 | Excellent 10.6% |