Immigrants from Sri Lanka vs Armenian Single Mother Poverty
COMPARE
Immigrants from Sri Lanka
Armenian
Single Mother Poverty
Single Mother Poverty Comparison
Immigrants from Sri Lanka
Armenians
26.3%
SINGLE MOTHER POVERTY
100.0/ 100
METRIC RATING
26th/ 347
METRIC RANK
26.8%
SINGLE MOTHER POVERTY
99.9/ 100
METRIC RATING
42nd/ 347
METRIC RANK
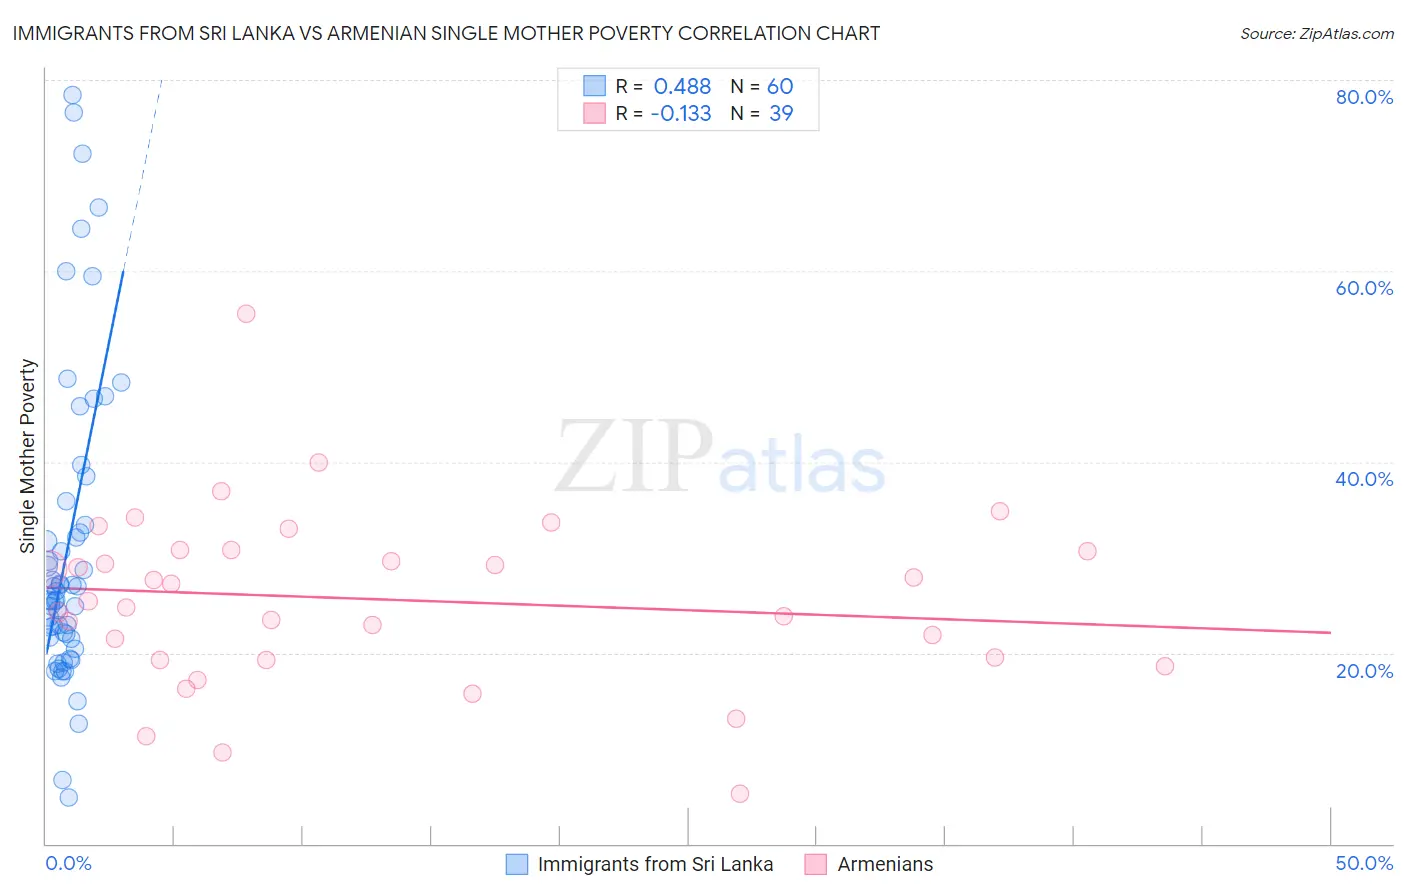
Immigrants from Sri Lanka vs Armenian Single Mother Poverty Correlation Chart
The statistical analysis conducted on geographies consisting of 147,892,421 people shows a moderate positive correlation between the proportion of Immigrants from Sri Lanka and poverty level among single mothers in the United States with a correlation coefficient (R) of 0.488 and weighted average of 26.3%. Similarly, the statistical analysis conducted on geographies consisting of 302,870,774 people shows a poor negative correlation between the proportion of Armenians and poverty level among single mothers in the United States with a correlation coefficient (R) of -0.133 and weighted average of 26.8%, a difference of 1.8%.
Single Mother Poverty Correlation Summary
| Measurement | Immigrants from Sri Lanka | Armenian |
| Minimum | 4.9% | 5.2% |
| Maximum | 78.5% | 55.5% |
| Range | 73.6% | 50.3% |
| Mean | 31.2% | 25.6% |
| Median | 26.0% | 25.4% |
| Interquartile 25% (IQ1) | 21.6% | 19.2% |
| Interquartile 75% (IQ3) | 34.6% | 30.7% |
| Interquartile Range (IQR) | 13.0% | 11.5% |
| Standard Deviation (Sample) | 16.5% | 9.2% |
| Standard Deviation (Population) | 16.3% | 9.1% |
Demographics Similar to Immigrants from Sri Lanka and Armenians by Single Mother Poverty
In terms of single mother poverty, the demographic groups most similar to Immigrants from Sri Lanka are Immigrants from Asia (26.3%, a difference of 0.13%), Immigrants from Japan (26.4%, a difference of 0.22%), Korean (26.4%, a difference of 0.24%), Jordanian (26.4%, a difference of 0.29%), and Immigrants from Moldova (26.2%, a difference of 0.32%). Similarly, the demographic groups most similar to Armenians are Tsimshian (26.8%, a difference of 0.080%), Immigrants from Sierra Leone (26.9%, a difference of 0.22%), Immigrants from Greece (26.7%, a difference of 0.23%), Immigrants from Vietnam (26.7%, a difference of 0.31%), and Sri Lankan (26.7%, a difference of 0.40%).
| Demographics | Rating | Rank | Single Mother Poverty |
| Immigrants | Moldova | 100.0 /100 | #24 | Exceptional 26.2% |
| Immigrants | Asia | 100.0 /100 | #25 | Exceptional 26.3% |
| Immigrants | Sri Lanka | 100.0 /100 | #26 | Exceptional 26.3% |
| Immigrants | Japan | 100.0 /100 | #27 | Exceptional 26.4% |
| Koreans | 100.0 /100 | #28 | Exceptional 26.4% |
| Jordanians | 100.0 /100 | #29 | Exceptional 26.4% |
| Turks | 100.0 /100 | #30 | Exceptional 26.4% |
| Immigrants | Philippines | 100.0 /100 | #31 | Exceptional 26.5% |
| Tongans | 99.9 /100 | #32 | Exceptional 26.5% |
| Bulgarians | 99.9 /100 | #33 | Exceptional 26.5% |
| Immigrants | Indonesia | 99.9 /100 | #34 | Exceptional 26.6% |
| Maltese | 99.9 /100 | #35 | Exceptional 26.6% |
| Okinawans | 99.9 /100 | #36 | Exceptional 26.6% |
| Immigrants | Israel | 99.9 /100 | #37 | Exceptional 26.6% |
| Immigrants | Fiji | 99.9 /100 | #38 | Exceptional 26.6% |
| Sri Lankans | 99.9 /100 | #39 | Exceptional 26.7% |
| Immigrants | Vietnam | 99.9 /100 | #40 | Exceptional 26.7% |
| Immigrants | Greece | 99.9 /100 | #41 | Exceptional 26.7% |
| Armenians | 99.9 /100 | #42 | Exceptional 26.8% |
| Tsimshian | 99.9 /100 | #43 | Exceptional 26.8% |
| Immigrants | Sierra Leone | 99.9 /100 | #44 | Exceptional 26.9% |