Immigrants from Spain vs Immigrants from El Salvador Receiving Food Stamps
COMPARE
Immigrants from Spain
Immigrants from El Salvador
Receiving Food Stamps
Receiving Food Stamps Comparison
Immigrants from Spain
Immigrants from El Salvador
11.1%
RECEIVING FOOD STAMPS
81.7/ 100
METRIC RATING
151st/ 347
METRIC RANK
13.5%
RECEIVING FOOD STAMPS
1.5/ 100
METRIC RATING
237th/ 347
METRIC RANK
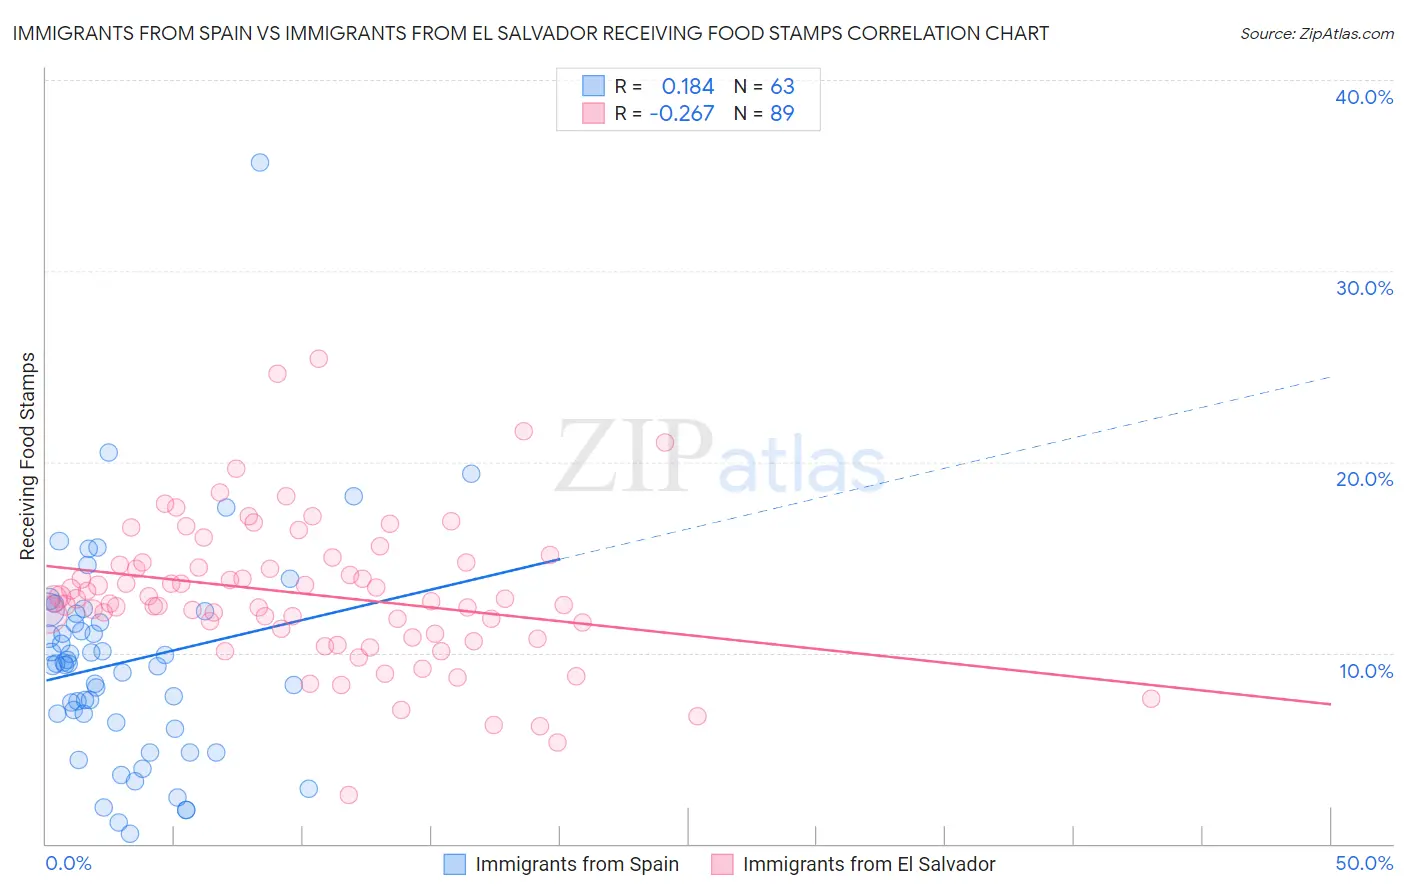
Immigrants from Spain vs Immigrants from El Salvador Receiving Food Stamps Correlation Chart
The statistical analysis conducted on geographies consisting of 239,167,111 people shows a poor positive correlation between the proportion of Immigrants from Spain and percentage of population receiving government assistance and/or food stamps in the United States with a correlation coefficient (R) of 0.184 and weighted average of 11.1%. Similarly, the statistical analysis conducted on geographies consisting of 357,240,396 people shows a weak negative correlation between the proportion of Immigrants from El Salvador and percentage of population receiving government assistance and/or food stamps in the United States with a correlation coefficient (R) of -0.267 and weighted average of 13.5%, a difference of 20.9%.
Receiving Food Stamps Correlation Summary
| Measurement | Immigrants from Spain | Immigrants from El Salvador |
| Minimum | 0.50% | 2.5% |
| Maximum | 35.7% | 25.4% |
| Range | 35.2% | 22.9% |
| Mean | 9.5% | 13.1% |
| Median | 9.4% | 12.8% |
| Interquartile 25% (IQ1) | 6.3% | 10.9% |
| Interquartile 75% (IQ3) | 12.0% | 14.7% |
| Interquartile Range (IQR) | 5.7% | 3.8% |
| Standard Deviation (Sample) | 5.6% | 3.8% |
| Standard Deviation (Population) | 5.6% | 3.8% |
Similar Demographics by Receiving Food Stamps
Demographics Similar to Immigrants from Spain by Receiving Food Stamps
In terms of receiving food stamps, the demographic groups most similar to Immigrants from Spain are Immigrants from Kazakhstan (11.1%, a difference of 0.0%), Lebanese (11.1%, a difference of 0.020%), Armenian (11.1%, a difference of 0.090%), Immigrants from Argentina (11.2%, a difference of 0.33%), and Soviet Union (11.1%, a difference of 0.36%).
| Demographics | Rating | Rank | Receiving Food Stamps |
| Syrians | 85.5 /100 | #144 | Excellent 11.0% |
| Hungarians | 85.1 /100 | #145 | Excellent 11.0% |
| Taiwanese | 84.2 /100 | #146 | Excellent 11.0% |
| Whites/Caucasians | 83.9 /100 | #147 | Excellent 11.1% |
| Immigrants | South Eastern Asia | 83.3 /100 | #148 | Excellent 11.1% |
| Brazilians | 83.2 /100 | #149 | Excellent 11.1% |
| Soviet Union | 83.1 /100 | #150 | Excellent 11.1% |
| Immigrants | Spain | 81.7 /100 | #151 | Excellent 11.1% |
| Immigrants | Kazakhstan | 81.7 /100 | #152 | Excellent 11.1% |
| Lebanese | 81.6 /100 | #153 | Excellent 11.1% |
| Armenians | 81.4 /100 | #154 | Excellent 11.1% |
| Immigrants | Argentina | 80.4 /100 | #155 | Excellent 11.2% |
| Immigrants | Afghanistan | 75.6 /100 | #156 | Good 11.3% |
| Immigrants | Lebanon | 75.2 /100 | #157 | Good 11.3% |
| Immigrants | Bosnia and Herzegovina | 72.6 /100 | #158 | Good 11.3% |
Demographics Similar to Immigrants from El Salvador by Receiving Food Stamps
In terms of receiving food stamps, the demographic groups most similar to Immigrants from El Salvador are French American Indian (13.5%, a difference of 0.20%), Crow (13.4%, a difference of 0.22%), Immigrants from Micronesia (13.5%, a difference of 0.42%), Immigrants from Zaire (13.4%, a difference of 0.67%), and Iroquois (13.5%, a difference of 0.72%).
| Demographics | Rating | Rank | Receiving Food Stamps |
| Puget Sound Salish | 3.4 /100 | #230 | Tragic 13.1% |
| Immigrants | Nigeria | 3.4 /100 | #231 | Tragic 13.1% |
| Salvadorans | 2.7 /100 | #232 | Tragic 13.2% |
| Cherokee | 2.5 /100 | #233 | Tragic 13.2% |
| Comanche | 2.4 /100 | #234 | Tragic 13.3% |
| Immigrants | Zaire | 1.9 /100 | #235 | Tragic 13.4% |
| Crow | 1.6 /100 | #236 | Tragic 13.4% |
| Immigrants | El Salvador | 1.5 /100 | #237 | Tragic 13.5% |
| French American Indians | 1.4 /100 | #238 | Tragic 13.5% |
| Immigrants | Micronesia | 1.3 /100 | #239 | Tragic 13.5% |
| Iroquois | 1.2 /100 | #240 | Tragic 13.5% |
| Choctaw | 1.0 /100 | #241 | Tragic 13.6% |
| Immigrants | Panama | 1.0 /100 | #242 | Tragic 13.6% |
| Somalis | 0.9 /100 | #243 | Tragic 13.7% |
| Cajuns | 0.9 /100 | #244 | Tragic 13.7% |