Immigrants from Spain vs Croatian Receiving Food Stamps
COMPARE
Immigrants from Spain
Croatian
Receiving Food Stamps
Receiving Food Stamps Comparison
Immigrants from Spain
Croatians
11.1%
RECEIVING FOOD STAMPS
81.7/ 100
METRIC RATING
151st/ 347
METRIC RANK
9.6%
RECEIVING FOOD STAMPS
99.5/ 100
METRIC RATING
43rd/ 347
METRIC RANK
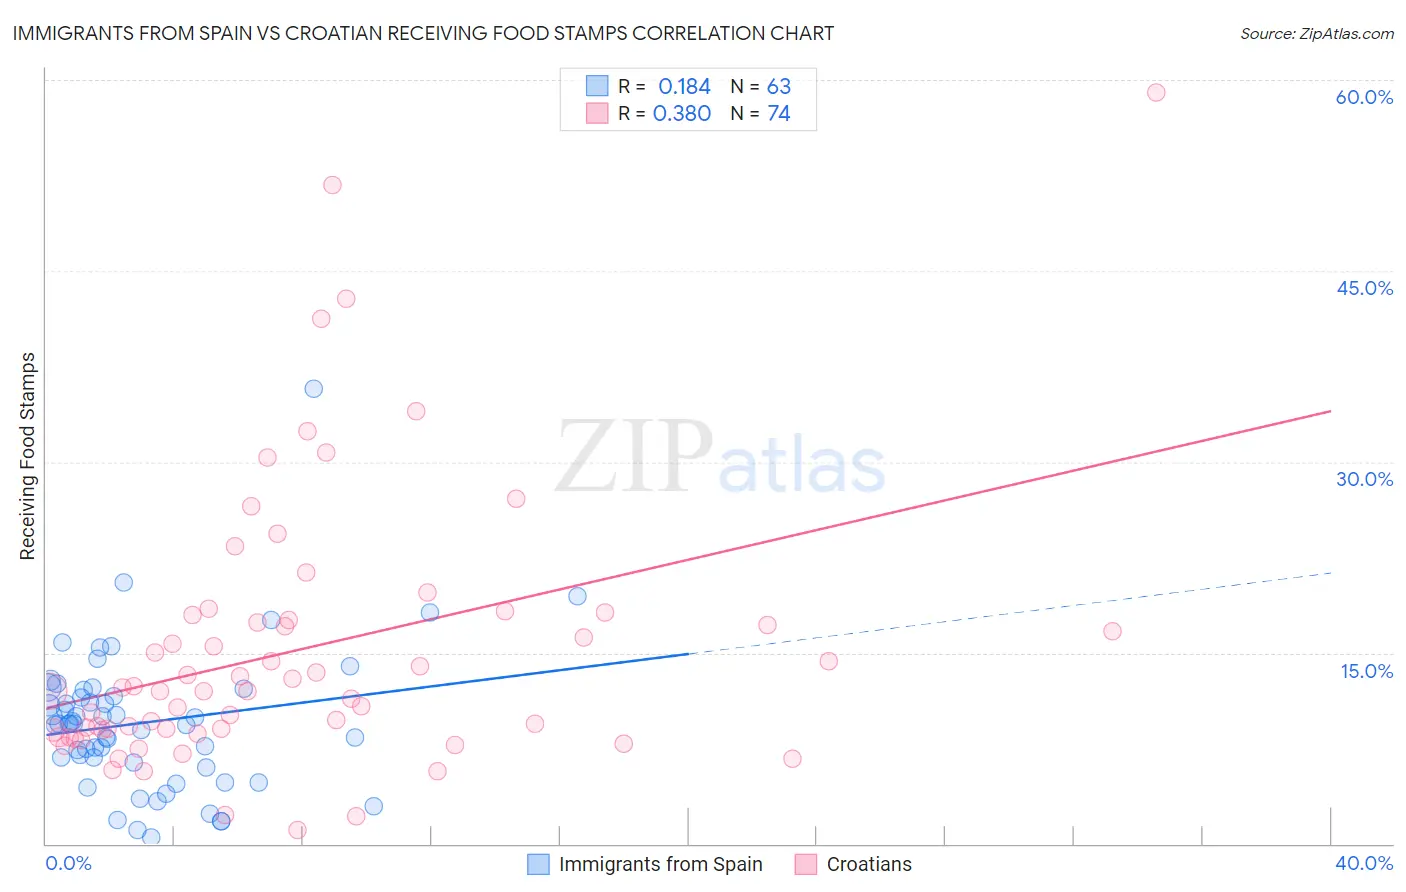
Immigrants from Spain vs Croatian Receiving Food Stamps Correlation Chart
The statistical analysis conducted on geographies consisting of 239,167,111 people shows a poor positive correlation between the proportion of Immigrants from Spain and percentage of population receiving government assistance and/or food stamps in the United States with a correlation coefficient (R) of 0.184 and weighted average of 11.1%. Similarly, the statistical analysis conducted on geographies consisting of 374,551,597 people shows a mild positive correlation between the proportion of Croatians and percentage of population receiving government assistance and/or food stamps in the United States with a correlation coefficient (R) of 0.380 and weighted average of 9.6%, a difference of 16.0%.
Receiving Food Stamps Correlation Summary
| Measurement | Immigrants from Spain | Croatian |
| Minimum | 0.50% | 1.1% |
| Maximum | 35.7% | 59.0% |
| Range | 35.2% | 57.9% |
| Mean | 9.5% | 15.2% |
| Median | 9.4% | 12.0% |
| Interquartile 25% (IQ1) | 6.3% | 8.9% |
| Interquartile 75% (IQ3) | 12.0% | 17.6% |
| Interquartile Range (IQR) | 5.7% | 8.7% |
| Standard Deviation (Sample) | 5.6% | 10.7% |
| Standard Deviation (Population) | 5.6% | 10.7% |
Similar Demographics by Receiving Food Stamps
Demographics Similar to Immigrants from Spain by Receiving Food Stamps
In terms of receiving food stamps, the demographic groups most similar to Immigrants from Spain are Immigrants from Kazakhstan (11.1%, a difference of 0.0%), Lebanese (11.1%, a difference of 0.020%), Armenian (11.1%, a difference of 0.090%), Immigrants from Argentina (11.2%, a difference of 0.33%), and Soviet Union (11.1%, a difference of 0.36%).
| Demographics | Rating | Rank | Receiving Food Stamps |
| Syrians | 85.5 /100 | #144 | Excellent 11.0% |
| Hungarians | 85.1 /100 | #145 | Excellent 11.0% |
| Taiwanese | 84.2 /100 | #146 | Excellent 11.0% |
| Whites/Caucasians | 83.9 /100 | #147 | Excellent 11.1% |
| Immigrants | South Eastern Asia | 83.3 /100 | #148 | Excellent 11.1% |
| Brazilians | 83.2 /100 | #149 | Excellent 11.1% |
| Soviet Union | 83.1 /100 | #150 | Excellent 11.1% |
| Immigrants | Spain | 81.7 /100 | #151 | Excellent 11.1% |
| Immigrants | Kazakhstan | 81.7 /100 | #152 | Excellent 11.1% |
| Lebanese | 81.6 /100 | #153 | Excellent 11.1% |
| Armenians | 81.4 /100 | #154 | Excellent 11.1% |
| Immigrants | Argentina | 80.4 /100 | #155 | Excellent 11.2% |
| Immigrants | Afghanistan | 75.6 /100 | #156 | Good 11.3% |
| Immigrants | Lebanon | 75.2 /100 | #157 | Good 11.3% |
| Immigrants | Bosnia and Herzegovina | 72.6 /100 | #158 | Good 11.3% |
Demographics Similar to Croatians by Receiving Food Stamps
In terms of receiving food stamps, the demographic groups most similar to Croatians are Immigrants from Denmark (9.6%, a difference of 0.23%), Immigrants from Belgium (9.6%, a difference of 0.26%), Immigrants from China (9.6%, a difference of 0.30%), Australian (9.6%, a difference of 0.34%), and Indian (Asian) (9.6%, a difference of 0.40%).
| Demographics | Rating | Rank | Receiving Food Stamps |
| Estonians | 99.6 /100 | #36 | Exceptional 9.5% |
| Europeans | 99.6 /100 | #37 | Exceptional 9.5% |
| Immigrants | Sri Lanka | 99.5 /100 | #38 | Exceptional 9.5% |
| Immigrants | Bolivia | 99.5 /100 | #39 | Exceptional 9.5% |
| Immigrants | Netherlands | 99.5 /100 | #40 | Exceptional 9.5% |
| Cambodians | 99.5 /100 | #41 | Exceptional 9.5% |
| Immigrants | China | 99.5 /100 | #42 | Exceptional 9.6% |
| Croatians | 99.5 /100 | #43 | Exceptional 9.6% |
| Immigrants | Denmark | 99.4 /100 | #44 | Exceptional 9.6% |
| Immigrants | Belgium | 99.4 /100 | #45 | Exceptional 9.6% |
| Australians | 99.4 /100 | #46 | Exceptional 9.6% |
| Indians (Asian) | 99.4 /100 | #47 | Exceptional 9.6% |
| Russians | 99.4 /100 | #48 | Exceptional 9.6% |
| Immigrants | Czechoslovakia | 99.4 /100 | #49 | Exceptional 9.6% |
| Lithuanians | 99.4 /100 | #50 | Exceptional 9.7% |