Immigrants from Spain vs Immigrants from El Salvador In Labor Force | Age 35-44
COMPARE
Immigrants from Spain
Immigrants from El Salvador
In Labor Force | Age 35-44
In Labor Force | Age 35-44 Comparison
Immigrants from Spain
Immigrants from El Salvador
84.7%
IN LABOR FORCE | AGE 35-44
90.6/ 100
METRIC RATING
127th/ 347
METRIC RANK
83.5%
IN LABOR FORCE | AGE 35-44
0.2/ 100
METRIC RATING
259th/ 347
METRIC RANK
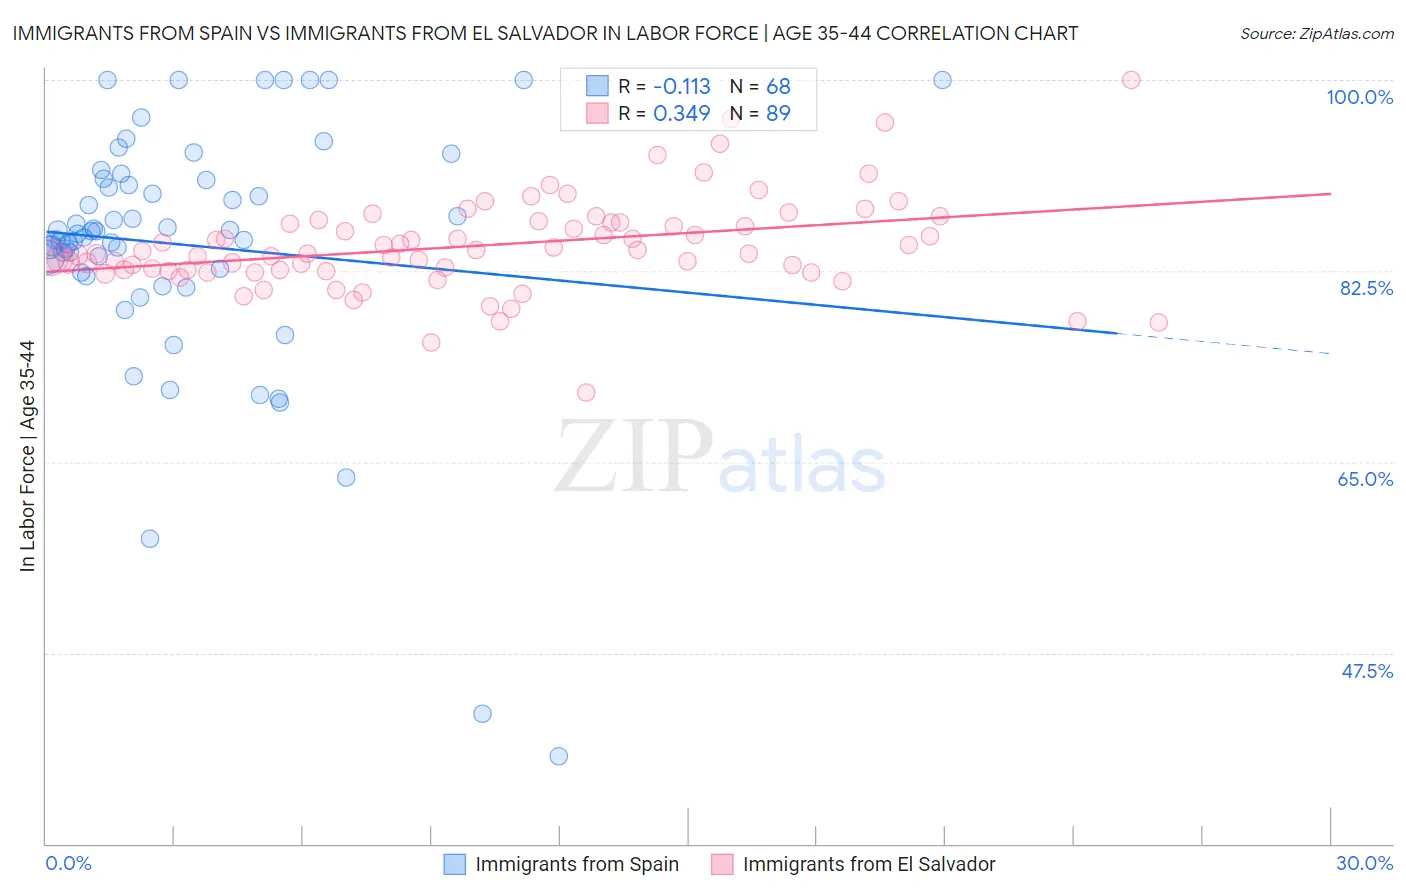
Immigrants from Spain vs Immigrants from El Salvador In Labor Force | Age 35-44 Correlation Chart
The statistical analysis conducted on geographies consisting of 239,621,275 people shows a poor negative correlation between the proportion of Immigrants from Spain and labor force participation rate among population between the ages 35 and 44 in the United States with a correlation coefficient (R) of -0.113 and weighted average of 84.7%. Similarly, the statistical analysis conducted on geographies consisting of 357,718,922 people shows a mild positive correlation between the proportion of Immigrants from El Salvador and labor force participation rate among population between the ages 35 and 44 in the United States with a correlation coefficient (R) of 0.349 and weighted average of 83.5%, a difference of 1.4%.
In Labor Force | Age 35-44 Correlation Summary
| Measurement | Immigrants from Spain | Immigrants from El Salvador |
| Minimum | 38.0% | 71.4% |
| Maximum | 100.0% | 100.0% |
| Range | 62.0% | 28.6% |
| Mean | 84.9% | 84.8% |
| Median | 86.0% | 84.1% |
| Interquartile 25% (IQ1) | 82.5% | 82.5% |
| Interquartile 75% (IQ3) | 90.9% | 86.9% |
| Interquartile Range (IQR) | 8.4% | 4.4% |
| Standard Deviation (Sample) | 11.7% | 4.4% |
| Standard Deviation (Population) | 11.6% | 4.3% |
Similar Demographics by In Labor Force | Age 35-44
Demographics Similar to Immigrants from Spain by In Labor Force | Age 35-44
In terms of in labor force | age 35-44, the demographic groups most similar to Immigrants from Spain are Slavic (84.7%, a difference of 0.0%), Maltese (84.7%, a difference of 0.0%), Asian (84.7%, a difference of 0.0%), Immigrants from Ghana (84.7%, a difference of 0.0%), and Finnish (84.7%, a difference of 0.010%).
| Demographics | Rating | Rank | In Labor Force | Age 35-44 |
| Immigrants | Northern Europe | 91.5 /100 | #120 | Exceptional 84.7% |
| Finns | 91.2 /100 | #121 | Exceptional 84.7% |
| Germans | 91.0 /100 | #122 | Exceptional 84.7% |
| Immigrants | South America | 90.9 /100 | #123 | Exceptional 84.7% |
| Slavs | 90.8 /100 | #124 | Exceptional 84.7% |
| Maltese | 90.8 /100 | #125 | Exceptional 84.7% |
| Asians | 90.6 /100 | #126 | Exceptional 84.7% |
| Immigrants | Spain | 90.6 /100 | #127 | Exceptional 84.7% |
| Immigrants | Ghana | 90.4 /100 | #128 | Exceptional 84.7% |
| Palestinians | 89.7 /100 | #129 | Excellent 84.7% |
| Bhutanese | 89.7 /100 | #130 | Excellent 84.7% |
| Immigrants | Scotland | 89.6 /100 | #131 | Excellent 84.7% |
| Austrians | 89.4 /100 | #132 | Excellent 84.7% |
| Argentineans | 88.4 /100 | #133 | Excellent 84.6% |
| Immigrants | Korea | 88.2 /100 | #134 | Excellent 84.6% |
Demographics Similar to Immigrants from El Salvador by In Labor Force | Age 35-44
In terms of in labor force | age 35-44, the demographic groups most similar to Immigrants from El Salvador are Vietnamese (83.5%, a difference of 0.010%), Immigrants from Dominica (83.5%, a difference of 0.010%), Tsimshian (83.5%, a difference of 0.020%), Immigrants from Congo (83.5%, a difference of 0.020%), and Basque (83.6%, a difference of 0.050%).
| Demographics | Rating | Rank | In Labor Force | Age 35-44 |
| Immigrants | Guyana | 0.4 /100 | #252 | Tragic 83.6% |
| Lebanese | 0.4 /100 | #253 | Tragic 83.6% |
| Tongans | 0.4 /100 | #254 | Tragic 83.6% |
| Immigrants | Azores | 0.3 /100 | #255 | Tragic 83.6% |
| Japanese | 0.3 /100 | #256 | Tragic 83.6% |
| Basques | 0.3 /100 | #257 | Tragic 83.6% |
| Tsimshian | 0.2 /100 | #258 | Tragic 83.5% |
| Immigrants | El Salvador | 0.2 /100 | #259 | Tragic 83.5% |
| Vietnamese | 0.2 /100 | #260 | Tragic 83.5% |
| Immigrants | Dominica | 0.2 /100 | #261 | Tragic 83.5% |
| Immigrants | Congo | 0.2 /100 | #262 | Tragic 83.5% |
| Iroquois | 0.2 /100 | #263 | Tragic 83.5% |
| Scotch-Irish | 0.1 /100 | #264 | Tragic 83.5% |
| Central Americans | 0.1 /100 | #265 | Tragic 83.5% |
| Spaniards | 0.1 /100 | #266 | Tragic 83.4% |