Immigrants from Southern Europe vs Pueblo Female Poverty Among 18-24 Year Olds
COMPARE
Immigrants from Southern Europe
Pueblo
Female Poverty Among 18-24 Year Olds
Female Poverty Among 18-24 Year Olds Comparison
Immigrants from Southern Europe
Pueblo
18.2%
FEMALE POVERTY AMONG 18-24 YEAR OLDS
100.0/ 100
METRIC RATING
46th/ 347
METRIC RANK
26.9%
FEMALE POVERTY AMONG 18-24 YEAR OLDS
0.0/ 100
METRIC RATING
334th/ 347
METRIC RANK
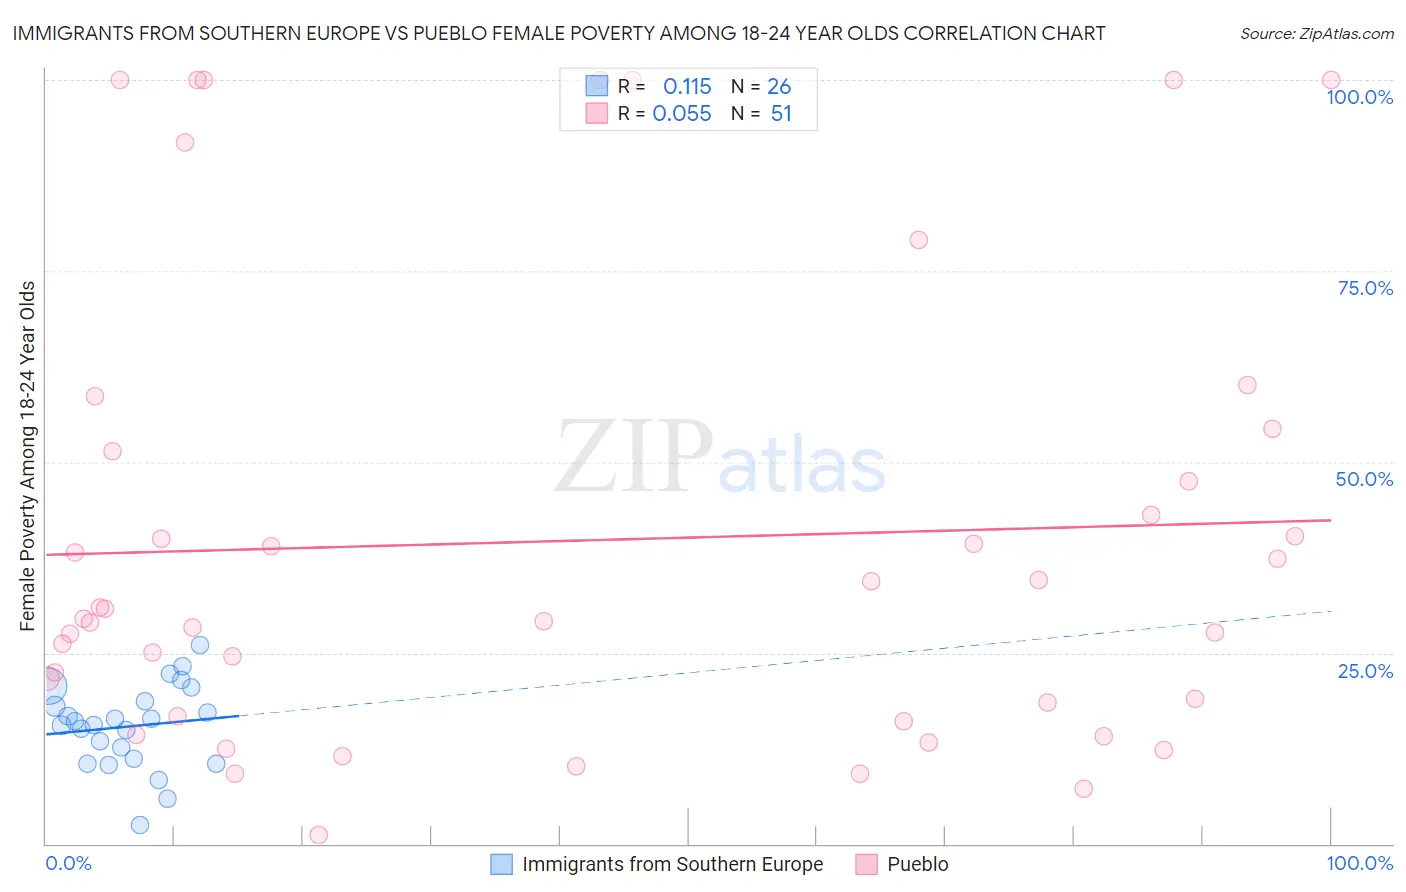
Immigrants from Southern Europe vs Pueblo Female Poverty Among 18-24 Year Olds Correlation Chart
The statistical analysis conducted on geographies consisting of 389,452,737 people shows a poor positive correlation between the proportion of Immigrants from Southern Europe and poverty level among females between the ages 18 and 24 in the United States with a correlation coefficient (R) of 0.115 and weighted average of 18.2%. Similarly, the statistical analysis conducted on geographies consisting of 119,346,276 people shows a slight positive correlation between the proportion of Pueblo and poverty level among females between the ages 18 and 24 in the United States with a correlation coefficient (R) of 0.055 and weighted average of 26.9%, a difference of 48.1%.
Female Poverty Among 18-24 Year Olds Correlation Summary
| Measurement | Immigrants from Southern Europe | Pueblo |
| Minimum | 2.5% | 1.1% |
| Maximum | 26.1% | 100.0% |
| Range | 23.6% | 98.9% |
| Mean | 15.4% | 39.7% |
| Median | 15.8% | 29.4% |
| Interquartile 25% (IQ1) | 11.2% | 16.7% |
| Interquartile 75% (IQ3) | 18.7% | 51.5% |
| Interquartile Range (IQR) | 7.5% | 34.8% |
| Standard Deviation (Sample) | 5.5% | 29.9% |
| Standard Deviation (Population) | 5.4% | 29.6% |
Similar Demographics by Female Poverty Among 18-24 Year Olds
Demographics Similar to Immigrants from Southern Europe by Female Poverty Among 18-24 Year Olds
In terms of female poverty among 18-24 year olds, the demographic groups most similar to Immigrants from Southern Europe are Asian (18.2%, a difference of 0.080%), Sri Lankan (18.2%, a difference of 0.13%), Bhutanese (18.2%, a difference of 0.16%), Samoan (18.2%, a difference of 0.27%), and Spanish American Indian (18.1%, a difference of 0.28%).
| Demographics | Rating | Rank | Female Poverty Among 18-24 Year Olds |
| Puget Sound Salish | 100.0 /100 | #39 | Exceptional 18.0% |
| Immigrants | Romania | 100.0 /100 | #40 | Exceptional 18.0% |
| Immigrants | Argentina | 100.0 /100 | #41 | Exceptional 18.0% |
| Bulgarians | 100.0 /100 | #42 | Exceptional 18.1% |
| Macedonians | 100.0 /100 | #43 | Exceptional 18.1% |
| Nicaraguans | 100.0 /100 | #44 | Exceptional 18.1% |
| Spanish American Indians | 100.0 /100 | #45 | Exceptional 18.1% |
| Immigrants | Southern Europe | 100.0 /100 | #46 | Exceptional 18.2% |
| Asians | 100.0 /100 | #47 | Exceptional 18.2% |
| Sri Lankans | 100.0 /100 | #48 | Exceptional 18.2% |
| Bhutanese | 100.0 /100 | #49 | Exceptional 18.2% |
| Samoans | 100.0 /100 | #50 | Exceptional 18.2% |
| Immigrants | Eastern Europe | 99.9 /100 | #51 | Exceptional 18.2% |
| Immigrants | Ireland | 99.9 /100 | #52 | Exceptional 18.3% |
| Italians | 99.9 /100 | #53 | Exceptional 18.3% |
Demographics Similar to Pueblo by Female Poverty Among 18-24 Year Olds
In terms of female poverty among 18-24 year olds, the demographic groups most similar to Pueblo are Yup'ik (27.0%, a difference of 0.45%), Apache (26.3%, a difference of 2.2%), Immigrants from Yemen (27.5%, a difference of 2.4%), Houma (26.2%, a difference of 2.8%), and Chippewa (25.9%, a difference of 3.8%).
| Demographics | Rating | Rank | Female Poverty Among 18-24 Year Olds |
| Ute | 0.0 /100 | #327 | Tragic 25.4% |
| Natives/Alaskans | 0.0 /100 | #328 | Tragic 25.4% |
| Cajuns | 0.0 /100 | #329 | Tragic 25.7% |
| Immigrants | Somalia | 0.0 /100 | #330 | Tragic 25.7% |
| Chippewa | 0.0 /100 | #331 | Tragic 25.9% |
| Houma | 0.0 /100 | #332 | Tragic 26.2% |
| Apache | 0.0 /100 | #333 | Tragic 26.3% |
| Pueblo | 0.0 /100 | #334 | Tragic 26.9% |
| Yup'ik | 0.0 /100 | #335 | Tragic 27.0% |
| Immigrants | Yemen | 0.0 /100 | #336 | Tragic 27.5% |
| Cheyenne | 0.0 /100 | #337 | Tragic 28.1% |
| Hopi | 0.0 /100 | #338 | Tragic 28.2% |
| Pima | 0.0 /100 | #339 | Tragic 28.4% |
| Sioux | 0.0 /100 | #340 | Tragic 28.6% |
| Colville | 0.0 /100 | #341 | Tragic 29.0% |