Immigrants from Southern Europe vs Pueblo Unemployment Among Seniors over 75 years
COMPARE
Immigrants from Southern Europe
Pueblo
Unemployment Among Seniors over 75 years
Unemployment Among Seniors over 75 years Comparison
Immigrants from Southern Europe
Pueblo
9.2%
UNEMPLOYMENT AMONG SENIORS OVER 75 YEARS
2.8/ 100
METRIC RATING
241st/ 347
METRIC RANK
7.7%
UNEMPLOYMENT AMONG SENIORS OVER 75 YEARS
100.0/ 100
METRIC RATING
42nd/ 347
METRIC RANK
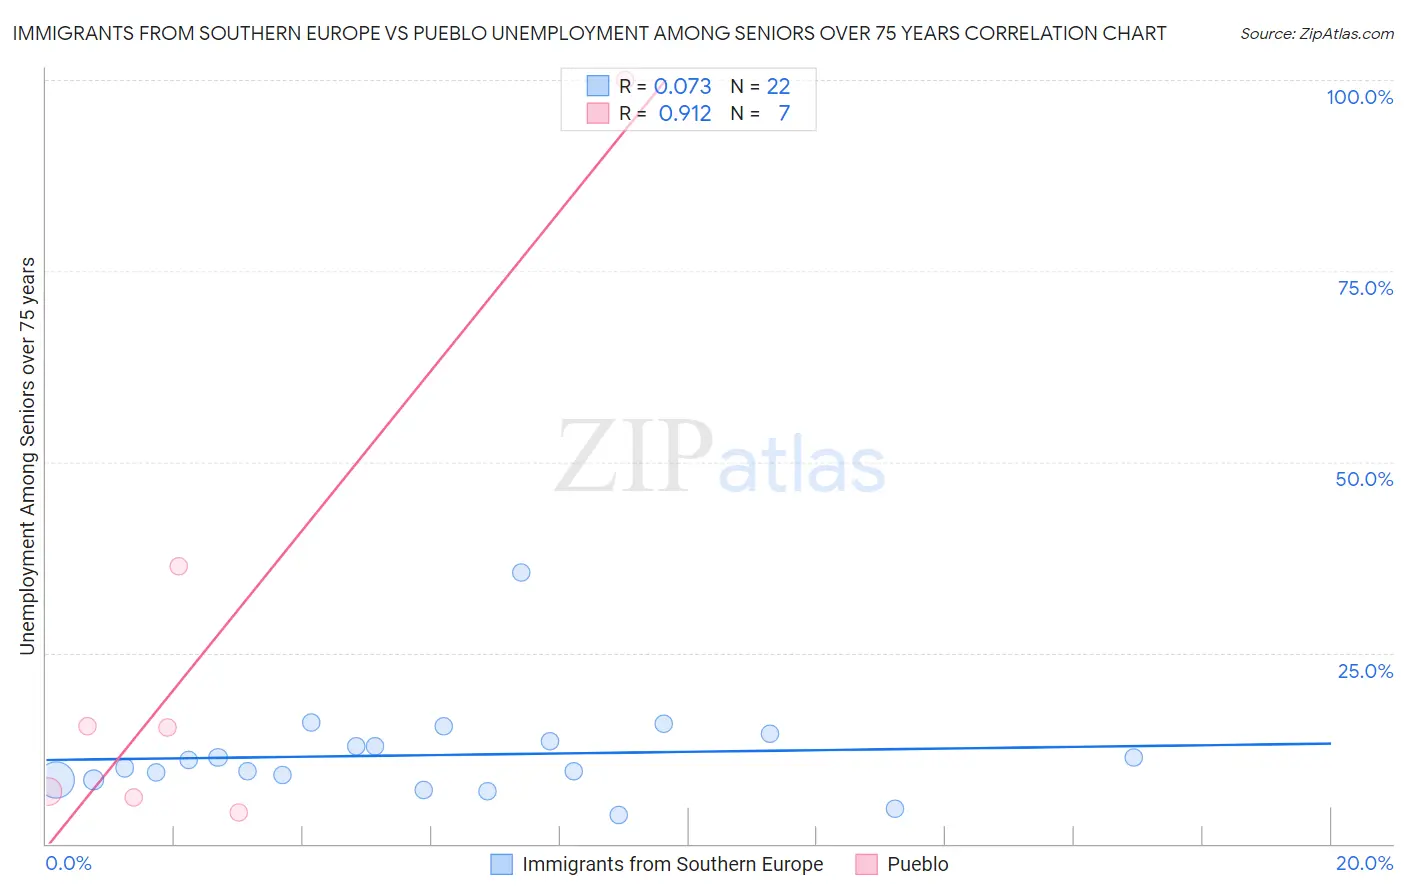
Immigrants from Southern Europe vs Pueblo Unemployment Among Seniors over 75 years Correlation Chart
The statistical analysis conducted on geographies consisting of 205,118,001 people shows a slight positive correlation between the proportion of Immigrants from Southern Europe and unemployment rate among seniors over the age of 75 in the United States with a correlation coefficient (R) of 0.073 and weighted average of 9.2%. Similarly, the statistical analysis conducted on geographies consisting of 86,150,940 people shows a near-perfect positive correlation between the proportion of Pueblo and unemployment rate among seniors over the age of 75 in the United States with a correlation coefficient (R) of 0.912 and weighted average of 7.7%, a difference of 18.3%.
Unemployment Among Seniors over 75 years Correlation Summary
| Measurement | Immigrants from Southern Europe | Pueblo |
| Minimum | 3.7% | 4.1% |
| Maximum | 35.5% | 100.0% |
| Range | 31.8% | 95.9% |
| Mean | 11.6% | 26.3% |
| Median | 10.5% | 15.2% |
| Interquartile 25% (IQ1) | 8.4% | 6.1% |
| Interquartile 75% (IQ3) | 13.4% | 36.4% |
| Interquartile Range (IQR) | 5.0% | 30.3% |
| Standard Deviation (Sample) | 6.3% | 34.3% |
| Standard Deviation (Population) | 6.2% | 31.8% |
Similar Demographics by Unemployment Among Seniors over 75 years
Demographics Similar to Immigrants from Southern Europe by Unemployment Among Seniors over 75 years
In terms of unemployment among seniors over 75 years, the demographic groups most similar to Immigrants from Southern Europe are Sierra Leonean (9.2%, a difference of 0.030%), Slavic (9.2%, a difference of 0.030%), Immigrants from Germany (9.2%, a difference of 0.060%), Immigrants from Canada (9.2%, a difference of 0.12%), and Spanish (9.1%, a difference of 0.21%).
| Demographics | Rating | Rank | Unemployment Among Seniors over 75 years |
| Vietnamese | 4.6 /100 | #234 | Tragic 9.1% |
| Panamanians | 4.0 /100 | #235 | Tragic 9.1% |
| Jordanians | 4.0 /100 | #236 | Tragic 9.1% |
| Houma | 3.9 /100 | #237 | Tragic 9.1% |
| Inupiat | 3.6 /100 | #238 | Tragic 9.1% |
| Mexicans | 3.5 /100 | #239 | Tragic 9.1% |
| Spanish | 3.3 /100 | #240 | Tragic 9.1% |
| Immigrants | Southern Europe | 2.8 /100 | #241 | Tragic 9.2% |
| Sierra Leoneans | 2.8 /100 | #242 | Tragic 9.2% |
| Slavs | 2.8 /100 | #243 | Tragic 9.2% |
| Immigrants | Germany | 2.7 /100 | #244 | Tragic 9.2% |
| Immigrants | Canada | 2.6 /100 | #245 | Tragic 9.2% |
| Immigrants | North America | 2.4 /100 | #246 | Tragic 9.2% |
| Sub-Saharan Africans | 2.3 /100 | #247 | Tragic 9.2% |
| Blackfeet | 2.3 /100 | #248 | Tragic 9.2% |
Demographics Similar to Pueblo by Unemployment Among Seniors over 75 years
In terms of unemployment among seniors over 75 years, the demographic groups most similar to Pueblo are Immigrants from Burma/Myanmar (7.7%, a difference of 0.23%), Immigrants from Denmark (7.8%, a difference of 0.30%), Immigrants from Spain (7.8%, a difference of 0.33%), British West Indian (7.8%, a difference of 0.34%), and Colville (7.7%, a difference of 0.37%).
| Demographics | Rating | Rank | Unemployment Among Seniors over 75 years |
| Immigrants | Norway | 100.0 /100 | #35 | Exceptional 7.7% |
| Luxembourgers | 100.0 /100 | #36 | Exceptional 7.7% |
| Immigrants | Hungary | 100.0 /100 | #37 | Exceptional 7.7% |
| Kiowa | 100.0 /100 | #38 | Exceptional 7.7% |
| Ugandans | 100.0 /100 | #39 | Exceptional 7.7% |
| Colville | 100.0 /100 | #40 | Exceptional 7.7% |
| Immigrants | Burma/Myanmar | 100.0 /100 | #41 | Exceptional 7.7% |
| Pueblo | 100.0 /100 | #42 | Exceptional 7.7% |
| Immigrants | Denmark | 100.0 /100 | #43 | Exceptional 7.8% |
| Immigrants | Spain | 100.0 /100 | #44 | Exceptional 7.8% |
| British West Indians | 100.0 /100 | #45 | Exceptional 7.8% |
| Immigrants | China | 100.0 /100 | #46 | Exceptional 7.8% |
| Creek | 100.0 /100 | #47 | Exceptional 7.8% |
| Immigrants | Chile | 100.0 /100 | #48 | Exceptional 7.8% |
| Potawatomi | 100.0 /100 | #49 | Exceptional 7.8% |