Immigrants from Southern Europe vs Immigrants from Western Africa Female Poverty Among 18-24 Year Olds
COMPARE
Immigrants from Southern Europe
Immigrants from Western Africa
Female Poverty Among 18-24 Year Olds
Female Poverty Among 18-24 Year Olds Comparison
Immigrants from Southern Europe
Immigrants from Western Africa
18.2%
FEMALE POVERTY AMONG 18-24 YEAR OLDS
100.0/ 100
METRIC RATING
46th/ 347
METRIC RANK
20.6%
FEMALE POVERTY AMONG 18-24 YEAR OLDS
10.2/ 100
METRIC RATING
216th/ 347
METRIC RANK
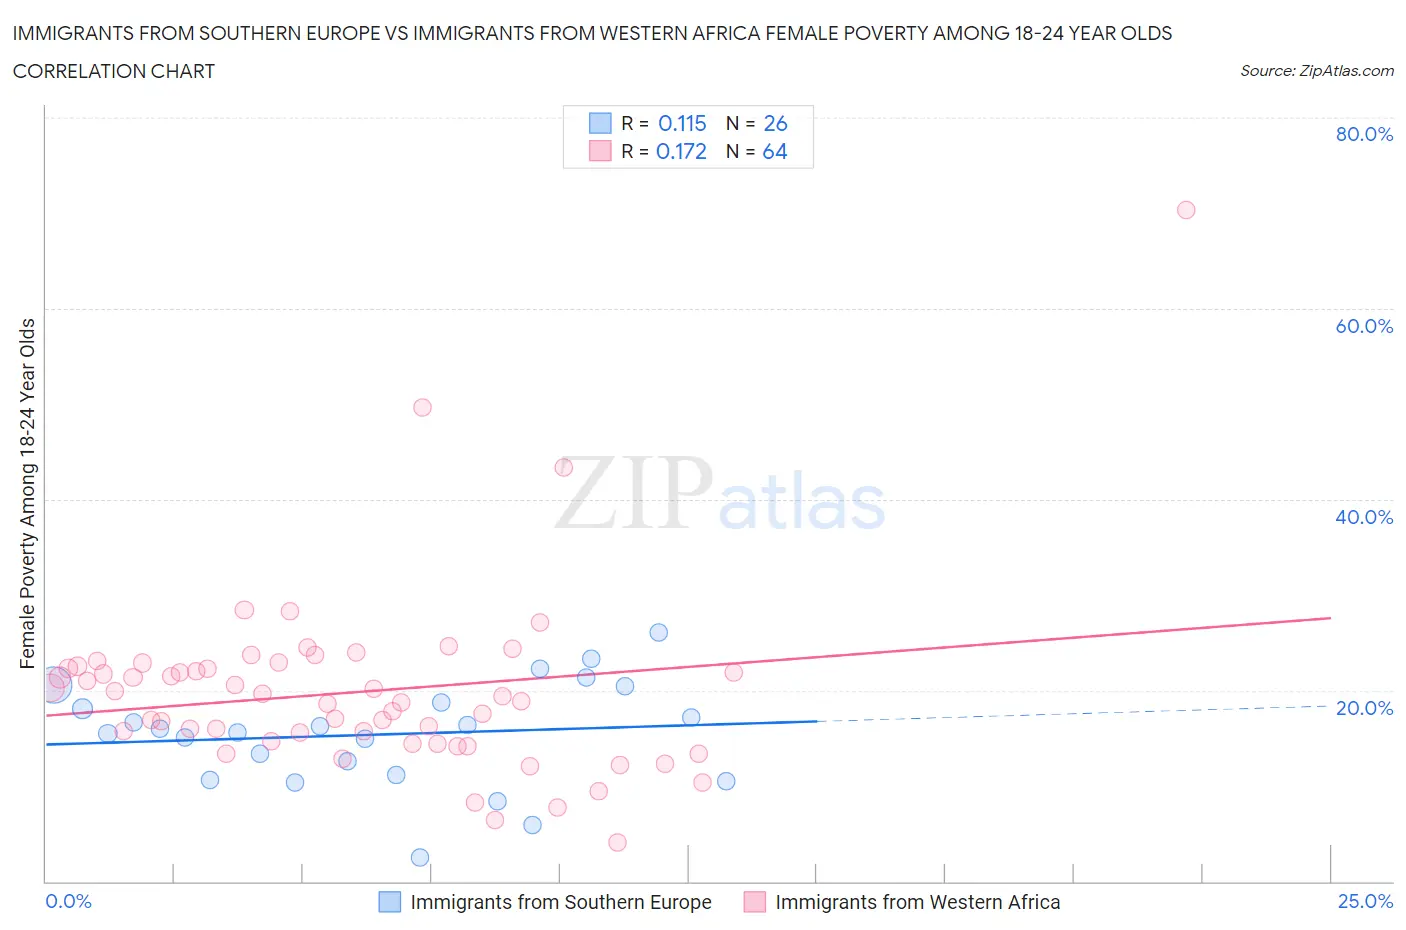
Immigrants from Southern Europe vs Immigrants from Western Africa Female Poverty Among 18-24 Year Olds Correlation Chart
The statistical analysis conducted on geographies consisting of 389,452,737 people shows a poor positive correlation between the proportion of Immigrants from Southern Europe and poverty level among females between the ages 18 and 24 in the United States with a correlation coefficient (R) of 0.115 and weighted average of 18.2%. Similarly, the statistical analysis conducted on geographies consisting of 351,136,823 people shows a poor positive correlation between the proportion of Immigrants from Western Africa and poverty level among females between the ages 18 and 24 in the United States with a correlation coefficient (R) of 0.172 and weighted average of 20.6%, a difference of 13.6%.
Female Poverty Among 18-24 Year Olds Correlation Summary
| Measurement | Immigrants from Southern Europe | Immigrants from Western Africa |
| Minimum | 2.5% | 4.0% |
| Maximum | 26.1% | 70.3% |
| Range | 23.6% | 66.3% |
| Mean | 15.4% | 19.8% |
| Median | 15.8% | 19.1% |
| Interquartile 25% (IQ1) | 11.2% | 14.6% |
| Interquartile 75% (IQ3) | 18.7% | 22.4% |
| Interquartile Range (IQR) | 7.5% | 7.8% |
| Standard Deviation (Sample) | 5.5% | 9.7% |
| Standard Deviation (Population) | 5.4% | 9.6% |
Similar Demographics by Female Poverty Among 18-24 Year Olds
Demographics Similar to Immigrants from Southern Europe by Female Poverty Among 18-24 Year Olds
In terms of female poverty among 18-24 year olds, the demographic groups most similar to Immigrants from Southern Europe are Asian (18.2%, a difference of 0.080%), Sri Lankan (18.2%, a difference of 0.13%), Bhutanese (18.2%, a difference of 0.16%), Samoan (18.2%, a difference of 0.27%), and Spanish American Indian (18.1%, a difference of 0.28%).
| Demographics | Rating | Rank | Female Poverty Among 18-24 Year Olds |
| Puget Sound Salish | 100.0 /100 | #39 | Exceptional 18.0% |
| Immigrants | Romania | 100.0 /100 | #40 | Exceptional 18.0% |
| Immigrants | Argentina | 100.0 /100 | #41 | Exceptional 18.0% |
| Bulgarians | 100.0 /100 | #42 | Exceptional 18.1% |
| Macedonians | 100.0 /100 | #43 | Exceptional 18.1% |
| Nicaraguans | 100.0 /100 | #44 | Exceptional 18.1% |
| Spanish American Indians | 100.0 /100 | #45 | Exceptional 18.1% |
| Immigrants | Southern Europe | 100.0 /100 | #46 | Exceptional 18.2% |
| Asians | 100.0 /100 | #47 | Exceptional 18.2% |
| Sri Lankans | 100.0 /100 | #48 | Exceptional 18.2% |
| Bhutanese | 100.0 /100 | #49 | Exceptional 18.2% |
| Samoans | 100.0 /100 | #50 | Exceptional 18.2% |
| Immigrants | Eastern Europe | 99.9 /100 | #51 | Exceptional 18.2% |
| Immigrants | Ireland | 99.9 /100 | #52 | Exceptional 18.3% |
| Italians | 99.9 /100 | #53 | Exceptional 18.3% |
Demographics Similar to Immigrants from Western Africa by Female Poverty Among 18-24 Year Olds
In terms of female poverty among 18-24 year olds, the demographic groups most similar to Immigrants from Western Africa are Spanish (20.6%, a difference of 0.020%), Immigrants from South Africa (20.6%, a difference of 0.050%), Immigrants from Laos (20.6%, a difference of 0.070%), Immigrants from Nepal (20.7%, a difference of 0.080%), and Immigrants from Micronesia (20.7%, a difference of 0.090%).
| Demographics | Rating | Rank | Female Poverty Among 18-24 Year Olds |
| Arabs | 15.5 /100 | #209 | Poor 20.5% |
| Immigrants | Ghana | 14.3 /100 | #210 | Poor 20.5% |
| Immigrants | Western Europe | 13.5 /100 | #211 | Poor 20.6% |
| Liberians | 11.6 /100 | #212 | Poor 20.6% |
| Northern Europeans | 11.6 /100 | #213 | Poor 20.6% |
| Immigrants | South Africa | 10.7 /100 | #214 | Poor 20.6% |
| Spanish | 10.4 /100 | #215 | Poor 20.6% |
| Immigrants | Western Africa | 10.2 /100 | #216 | Poor 20.6% |
| Immigrants | Laos | 9.7 /100 | #217 | Tragic 20.6% |
| Immigrants | Nepal | 9.6 /100 | #218 | Tragic 20.7% |
| Immigrants | Micronesia | 9.6 /100 | #219 | Tragic 20.7% |
| British | 9.4 /100 | #220 | Tragic 20.7% |
| Barbadians | 9.0 /100 | #221 | Tragic 20.7% |
| Guatemalans | 8.1 /100 | #222 | Tragic 20.7% |
| French | 7.9 /100 | #223 | Tragic 20.7% |