Immigrants from South Eastern Asia vs Alaska Native Female Poverty Among 25-34 Year Olds
COMPARE
Immigrants from South Eastern Asia
Alaska Native
Female Poverty Among 25-34 Year Olds
Female Poverty Among 25-34 Year Olds Comparison
Immigrants from South Eastern Asia
Alaska Natives
12.5%
FEMALE POVERTY AMONG 25-34 YEAR OLDS
97.6/ 100
METRIC RATING
85th/ 347
METRIC RANK
16.8%
FEMALE POVERTY AMONG 25-34 YEAR OLDS
0.0/ 100
METRIC RATING
302nd/ 347
METRIC RANK
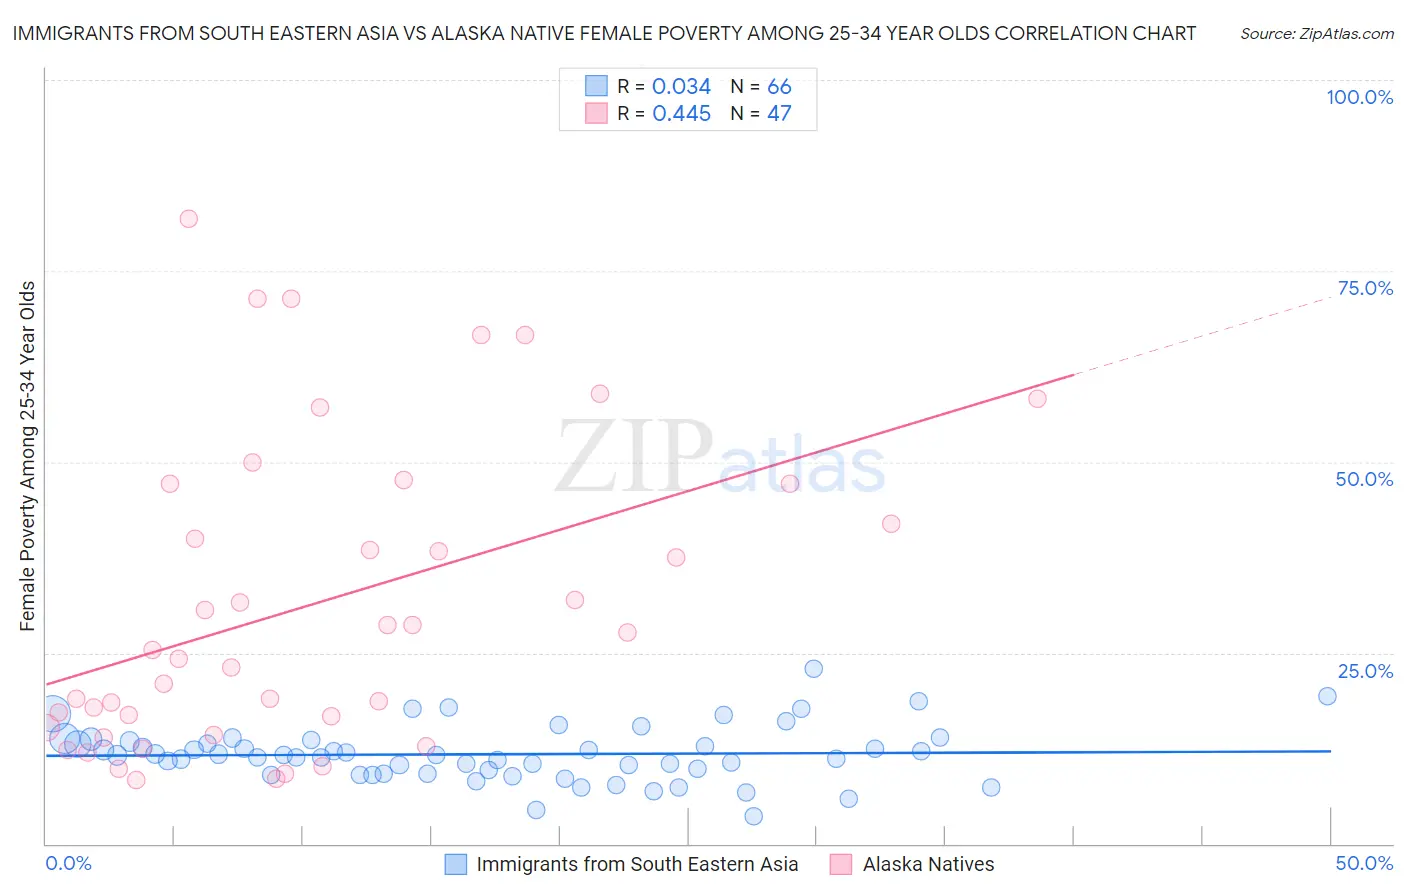
Immigrants from South Eastern Asia vs Alaska Native Female Poverty Among 25-34 Year Olds Correlation Chart
The statistical analysis conducted on geographies consisting of 499,745,803 people shows no correlation between the proportion of Immigrants from South Eastern Asia and poverty level among females between the ages 25 and 34 in the United States with a correlation coefficient (R) of 0.034 and weighted average of 12.5%. Similarly, the statistical analysis conducted on geographies consisting of 76,506,826 people shows a moderate positive correlation between the proportion of Alaska Natives and poverty level among females between the ages 25 and 34 in the United States with a correlation coefficient (R) of 0.445 and weighted average of 16.8%, a difference of 34.2%.
Female Poverty Among 25-34 Year Olds Correlation Summary
| Measurement | Immigrants from South Eastern Asia | Alaska Native |
| Minimum | 3.6% | 8.3% |
| Maximum | 23.0% | 81.8% |
| Range | 19.4% | 73.5% |
| Mean | 11.7% | 31.4% |
| Median | 11.6% | 25.4% |
| Interquartile 25% (IQ1) | 9.2% | 15.2% |
| Interquartile 75% (IQ3) | 13.4% | 47.1% |
| Interquartile Range (IQR) | 4.2% | 31.8% |
| Standard Deviation (Sample) | 3.6% | 20.0% |
| Standard Deviation (Population) | 3.6% | 19.8% |
Similar Demographics by Female Poverty Among 25-34 Year Olds
Demographics Similar to Immigrants from South Eastern Asia by Female Poverty Among 25-34 Year Olds
In terms of female poverty among 25-34 year olds, the demographic groups most similar to Immigrants from South Eastern Asia are Croatian (12.5%, a difference of 0.010%), Argentinean (12.5%, a difference of 0.040%), Immigrants from Latvia (12.5%, a difference of 0.11%), Immigrants from Austria (12.5%, a difference of 0.11%), and Albanian (12.5%, a difference of 0.17%).
| Demographics | Rating | Rank | Female Poverty Among 25-34 Year Olds |
| Immigrants | Ukraine | 98.6 /100 | #78 | Exceptional 12.3% |
| Immigrants | Jordan | 98.5 /100 | #79 | Exceptional 12.4% |
| Immigrants | Malaysia | 98.3 /100 | #80 | Exceptional 12.4% |
| Immigrants | Kazakhstan | 98.1 /100 | #81 | Exceptional 12.4% |
| Ethiopians | 98.0 /100 | #82 | Exceptional 12.4% |
| Albanians | 97.7 /100 | #83 | Exceptional 12.5% |
| Immigrants | Latvia | 97.7 /100 | #84 | Exceptional 12.5% |
| Immigrants | South Eastern Asia | 97.6 /100 | #85 | Exceptional 12.5% |
| Croatians | 97.5 /100 | #86 | Exceptional 12.5% |
| Argentineans | 97.5 /100 | #87 | Exceptional 12.5% |
| Immigrants | Austria | 97.4 /100 | #88 | Exceptional 12.5% |
| Italians | 97.2 /100 | #89 | Exceptional 12.5% |
| Immigrants | Albania | 97.1 /100 | #90 | Exceptional 12.5% |
| Norwegians | 96.9 /100 | #91 | Exceptional 12.6% |
| Immigrants | Armenia | 96.9 /100 | #92 | Exceptional 12.6% |
Demographics Similar to Alaska Natives by Female Poverty Among 25-34 Year Olds
In terms of female poverty among 25-34 year olds, the demographic groups most similar to Alaska Natives are Immigrants from Congo (16.7%, a difference of 0.11%), U.S. Virgin Islander (16.7%, a difference of 0.12%), Spanish American (16.7%, a difference of 0.27%), Blackfeet (16.7%, a difference of 0.31%), and Immigrants from Mexico (16.8%, a difference of 0.31%).
| Demographics | Rating | Rank | Female Poverty Among 25-34 Year Olds |
| Mexicans | 0.0 /100 | #295 | Tragic 16.6% |
| Hispanics or Latinos | 0.0 /100 | #296 | Tragic 16.6% |
| Immigrants | Guatemala | 0.0 /100 | #297 | Tragic 16.6% |
| Blackfeet | 0.0 /100 | #298 | Tragic 16.7% |
| Spanish Americans | 0.0 /100 | #299 | Tragic 16.7% |
| U.S. Virgin Islanders | 0.0 /100 | #300 | Tragic 16.7% |
| Immigrants | Congo | 0.0 /100 | #301 | Tragic 16.7% |
| Alaska Natives | 0.0 /100 | #302 | Tragic 16.8% |
| Immigrants | Mexico | 0.0 /100 | #303 | Tragic 16.8% |
| Hondurans | 0.0 /100 | #304 | Tragic 16.9% |
| Immigrants | Cabo Verde | 0.0 /100 | #305 | Tragic 16.9% |
| Chickasaw | 0.0 /100 | #306 | Tragic 17.0% |
| Yaqui | 0.0 /100 | #307 | Tragic 17.0% |
| Africans | 0.0 /100 | #308 | Tragic 17.0% |
| Ottawa | 0.0 /100 | #309 | Tragic 17.1% |