Immigrants from South Eastern Asia vs Puget Sound Salish Female Poverty Among 25-34 Year Olds
COMPARE
Immigrants from South Eastern Asia
Puget Sound Salish
Female Poverty Among 25-34 Year Olds
Female Poverty Among 25-34 Year Olds Comparison
Immigrants from South Eastern Asia
Puget Sound Salish
12.5%
FEMALE POVERTY AMONG 25-34 YEAR OLDS
97.6/ 100
METRIC RATING
85th/ 347
METRIC RANK
14.3%
FEMALE POVERTY AMONG 25-34 YEAR OLDS
6.5/ 100
METRIC RATING
213th/ 347
METRIC RANK
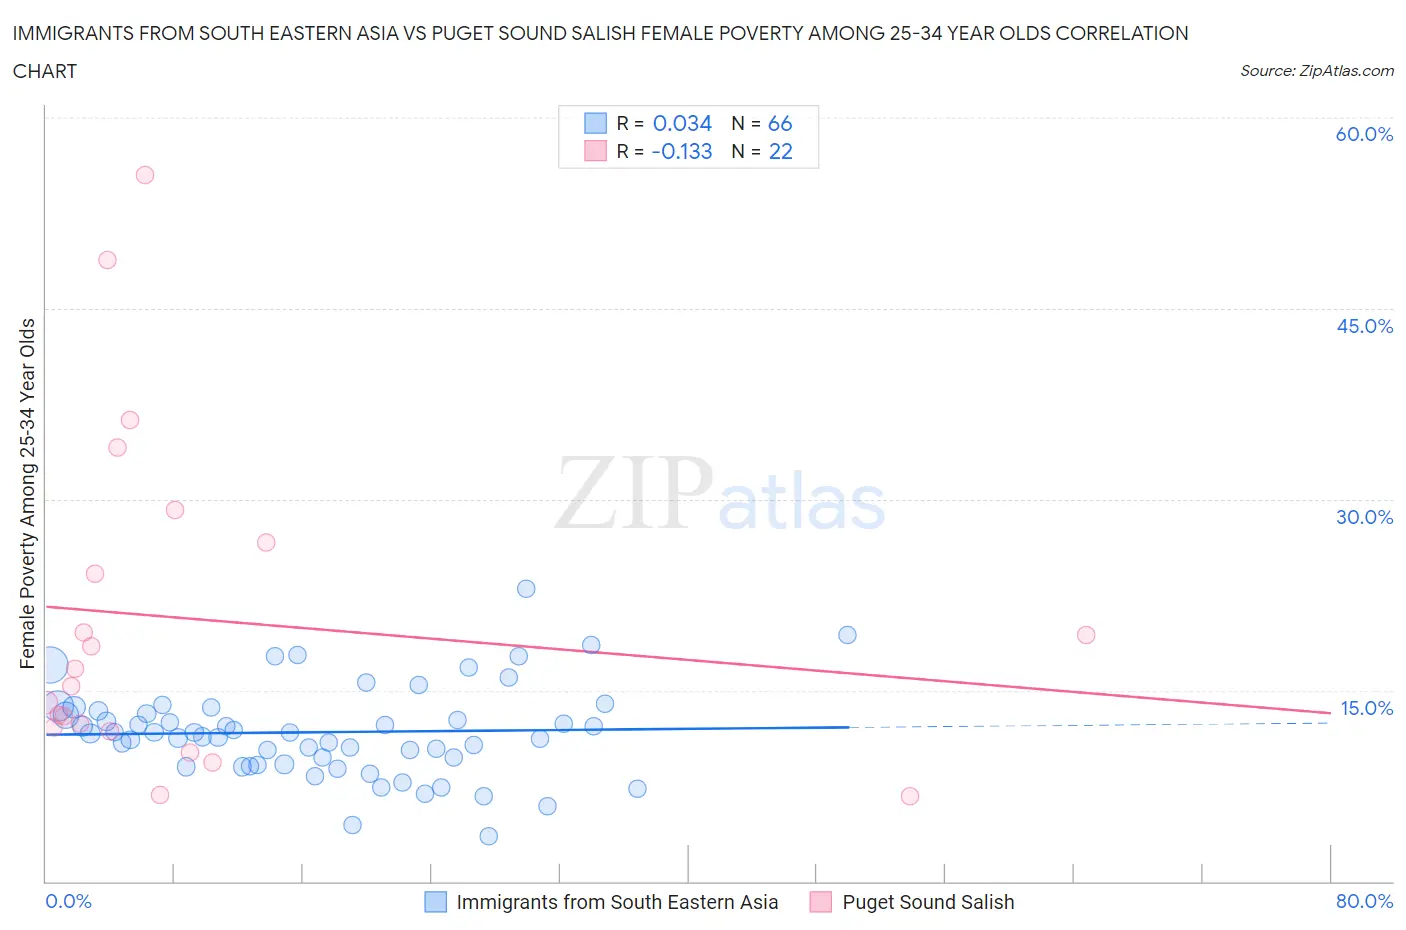
Immigrants from South Eastern Asia vs Puget Sound Salish Female Poverty Among 25-34 Year Olds Correlation Chart
The statistical analysis conducted on geographies consisting of 499,745,803 people shows no correlation between the proportion of Immigrants from South Eastern Asia and poverty level among females between the ages 25 and 34 in the United States with a correlation coefficient (R) of 0.034 and weighted average of 12.5%. Similarly, the statistical analysis conducted on geographies consisting of 45,969,058 people shows a poor negative correlation between the proportion of Puget Sound Salish and poverty level among females between the ages 25 and 34 in the United States with a correlation coefficient (R) of -0.133 and weighted average of 14.3%, a difference of 14.3%.
Female Poverty Among 25-34 Year Olds Correlation Summary
| Measurement | Immigrants from South Eastern Asia | Puget Sound Salish |
| Minimum | 3.6% | 6.7% |
| Maximum | 23.0% | 55.5% |
| Range | 19.4% | 48.8% |
| Mean | 11.7% | 20.6% |
| Median | 11.6% | 16.0% |
| Interquartile 25% (IQ1) | 9.2% | 12.0% |
| Interquartile 75% (IQ3) | 13.4% | 26.6% |
| Interquartile Range (IQR) | 4.2% | 14.5% |
| Standard Deviation (Sample) | 3.6% | 13.1% |
| Standard Deviation (Population) | 3.6% | 12.8% |
Similar Demographics by Female Poverty Among 25-34 Year Olds
Demographics Similar to Immigrants from South Eastern Asia by Female Poverty Among 25-34 Year Olds
In terms of female poverty among 25-34 year olds, the demographic groups most similar to Immigrants from South Eastern Asia are Croatian (12.5%, a difference of 0.010%), Argentinean (12.5%, a difference of 0.040%), Immigrants from Latvia (12.5%, a difference of 0.11%), Immigrants from Austria (12.5%, a difference of 0.11%), and Albanian (12.5%, a difference of 0.17%).
| Demographics | Rating | Rank | Female Poverty Among 25-34 Year Olds |
| Immigrants | Ukraine | 98.6 /100 | #78 | Exceptional 12.3% |
| Immigrants | Jordan | 98.5 /100 | #79 | Exceptional 12.4% |
| Immigrants | Malaysia | 98.3 /100 | #80 | Exceptional 12.4% |
| Immigrants | Kazakhstan | 98.1 /100 | #81 | Exceptional 12.4% |
| Ethiopians | 98.0 /100 | #82 | Exceptional 12.4% |
| Albanians | 97.7 /100 | #83 | Exceptional 12.5% |
| Immigrants | Latvia | 97.7 /100 | #84 | Exceptional 12.5% |
| Immigrants | South Eastern Asia | 97.6 /100 | #85 | Exceptional 12.5% |
| Croatians | 97.5 /100 | #86 | Exceptional 12.5% |
| Argentineans | 97.5 /100 | #87 | Exceptional 12.5% |
| Immigrants | Austria | 97.4 /100 | #88 | Exceptional 12.5% |
| Italians | 97.2 /100 | #89 | Exceptional 12.5% |
| Immigrants | Albania | 97.1 /100 | #90 | Exceptional 12.5% |
| Norwegians | 96.9 /100 | #91 | Exceptional 12.6% |
| Immigrants | Armenia | 96.9 /100 | #92 | Exceptional 12.6% |
Demographics Similar to Puget Sound Salish by Female Poverty Among 25-34 Year Olds
In terms of female poverty among 25-34 year olds, the demographic groups most similar to Puget Sound Salish are Immigrants from Guyana (14.3%, a difference of 0.030%), French (14.3%, a difference of 0.10%), Immigrants from Nigeria (14.3%, a difference of 0.12%), French Canadian (14.3%, a difference of 0.37%), and Spanish American Indian (14.3%, a difference of 0.38%).
| Demographics | Rating | Rank | Female Poverty Among 25-34 Year Olds |
| Hungarians | 11.8 /100 | #206 | Poor 14.1% |
| Japanese | 11.7 /100 | #207 | Poor 14.1% |
| Immigrants | Panama | 11.6 /100 | #208 | Poor 14.1% |
| Guyanese | 8.6 /100 | #209 | Tragic 14.2% |
| Panamanians | 8.6 /100 | #210 | Tragic 14.2% |
| Trinidadians and Tobagonians | 8.2 /100 | #211 | Tragic 14.2% |
| Immigrants | Guyana | 6.6 /100 | #212 | Tragic 14.3% |
| Puget Sound Salish | 6.5 /100 | #213 | Tragic 14.3% |
| French | 6.2 /100 | #214 | Tragic 14.3% |
| Immigrants | Nigeria | 6.2 /100 | #215 | Tragic 14.3% |
| French Canadians | 5.5 /100 | #216 | Tragic 14.3% |
| Spanish American Indians | 5.5 /100 | #217 | Tragic 14.3% |
| Immigrants | Thailand | 5.2 /100 | #218 | Tragic 14.3% |
| Ecuadorians | 5.2 /100 | #219 | Tragic 14.3% |
| Ghanaians | 4.8 /100 | #220 | Tragic 14.4% |