Immigrants from Belize vs Alaska Native Female Poverty Among 25-34 Year Olds
COMPARE
Immigrants from Belize
Alaska Native
Female Poverty Among 25-34 Year Olds
Female Poverty Among 25-34 Year Olds Comparison
Immigrants from Belize
Alaska Natives
15.3%
FEMALE POVERTY AMONG 25-34 YEAR OLDS
0.2/ 100
METRIC RATING
262nd/ 347
METRIC RANK
16.8%
FEMALE POVERTY AMONG 25-34 YEAR OLDS
0.0/ 100
METRIC RATING
302nd/ 347
METRIC RANK
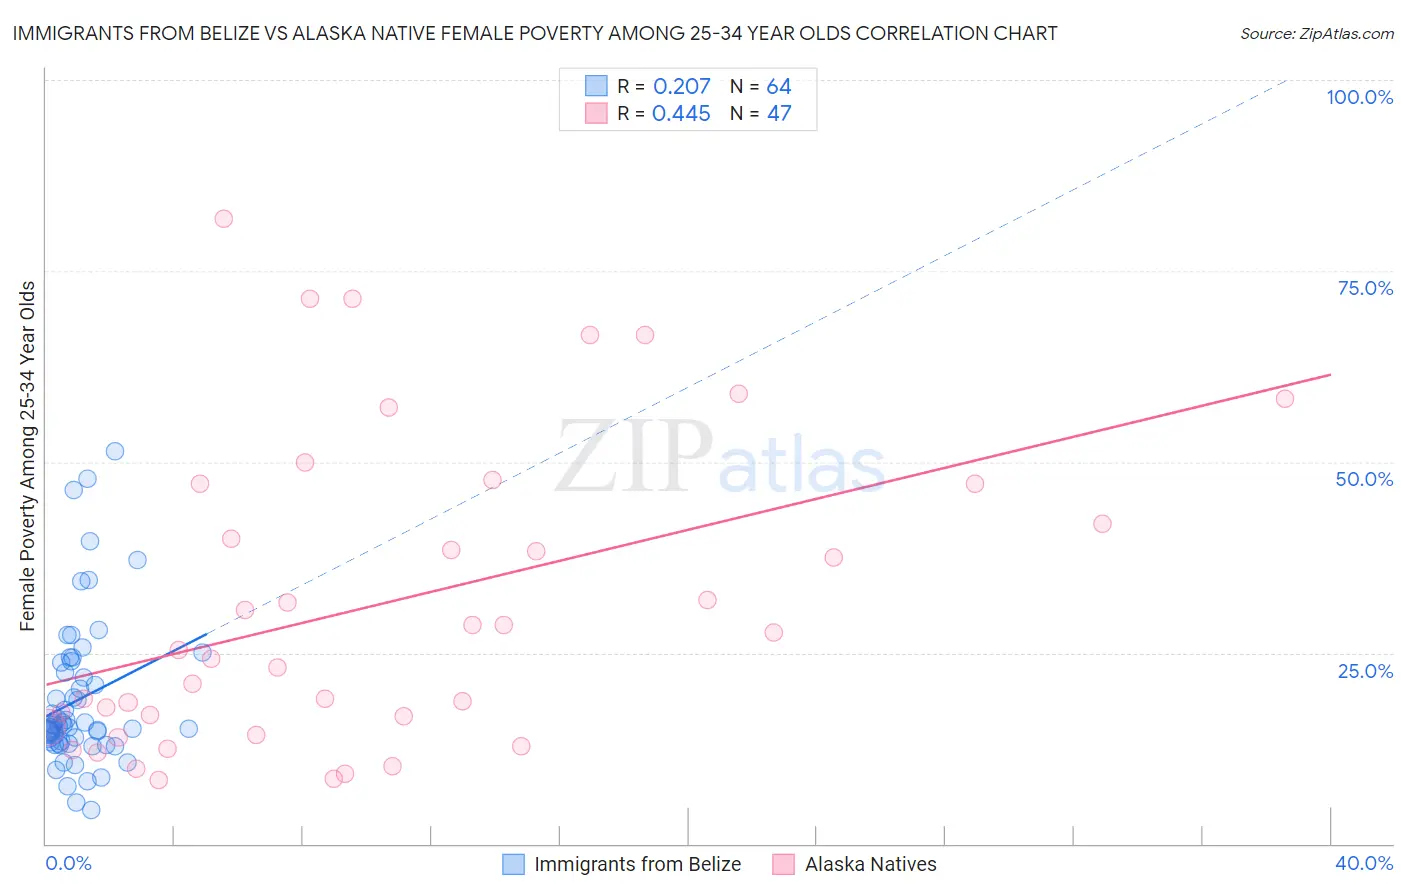
Immigrants from Belize vs Alaska Native Female Poverty Among 25-34 Year Olds Correlation Chart
The statistical analysis conducted on geographies consisting of 129,916,036 people shows a weak positive correlation between the proportion of Immigrants from Belize and poverty level among females between the ages 25 and 34 in the United States with a correlation coefficient (R) of 0.207 and weighted average of 15.3%. Similarly, the statistical analysis conducted on geographies consisting of 76,506,826 people shows a moderate positive correlation between the proportion of Alaska Natives and poverty level among females between the ages 25 and 34 in the United States with a correlation coefficient (R) of 0.445 and weighted average of 16.8%, a difference of 9.4%.
Female Poverty Among 25-34 Year Olds Correlation Summary
| Measurement | Immigrants from Belize | Alaska Native |
| Minimum | 4.5% | 8.3% |
| Maximum | 51.4% | 81.8% |
| Range | 46.9% | 73.5% |
| Mean | 18.9% | 31.4% |
| Median | 15.5% | 25.4% |
| Interquartile 25% (IQ1) | 13.2% | 15.2% |
| Interquartile 75% (IQ3) | 23.1% | 47.1% |
| Interquartile Range (IQR) | 9.9% | 31.8% |
| Standard Deviation (Sample) | 9.7% | 20.0% |
| Standard Deviation (Population) | 9.7% | 19.8% |
Similar Demographics by Female Poverty Among 25-34 Year Olds
Demographics Similar to Immigrants from Belize by Female Poverty Among 25-34 Year Olds
In terms of female poverty among 25-34 year olds, the demographic groups most similar to Immigrants from Belize are Liberian (15.3%, a difference of 0.040%), Mexican American Indian (15.4%, a difference of 0.24%), Marshallese (15.3%, a difference of 0.26%), Immigrants from Cuba (15.2%, a difference of 0.63%), and Nepalese (15.2%, a difference of 0.65%).
| Demographics | Rating | Rank | Female Poverty Among 25-34 Year Olds |
| Immigrants | Laos | 0.3 /100 | #255 | Tragic 15.2% |
| West Indians | 0.3 /100 | #256 | Tragic 15.2% |
| Immigrants | Burma/Myanmar | 0.3 /100 | #257 | Tragic 15.2% |
| Nepalese | 0.2 /100 | #258 | Tragic 15.2% |
| Immigrants | Cuba | 0.2 /100 | #259 | Tragic 15.2% |
| Marshallese | 0.2 /100 | #260 | Tragic 15.3% |
| Liberians | 0.2 /100 | #261 | Tragic 15.3% |
| Immigrants | Belize | 0.2 /100 | #262 | Tragic 15.3% |
| Mexican American Indians | 0.2 /100 | #263 | Tragic 15.4% |
| Pennsylvania Germans | 0.1 /100 | #264 | Tragic 15.4% |
| Immigrants | Liberia | 0.1 /100 | #265 | Tragic 15.4% |
| Immigrants | Somalia | 0.1 /100 | #266 | Tragic 15.4% |
| Central Americans | 0.1 /100 | #267 | Tragic 15.5% |
| Immigrants | Senegal | 0.1 /100 | #268 | Tragic 15.6% |
| Sub-Saharan Africans | 0.1 /100 | #269 | Tragic 15.6% |
Demographics Similar to Alaska Natives by Female Poverty Among 25-34 Year Olds
In terms of female poverty among 25-34 year olds, the demographic groups most similar to Alaska Natives are Immigrants from Congo (16.7%, a difference of 0.11%), U.S. Virgin Islander (16.7%, a difference of 0.12%), Spanish American (16.7%, a difference of 0.27%), Blackfeet (16.7%, a difference of 0.31%), and Immigrants from Mexico (16.8%, a difference of 0.31%).
| Demographics | Rating | Rank | Female Poverty Among 25-34 Year Olds |
| Mexicans | 0.0 /100 | #295 | Tragic 16.6% |
| Hispanics or Latinos | 0.0 /100 | #296 | Tragic 16.6% |
| Immigrants | Guatemala | 0.0 /100 | #297 | Tragic 16.6% |
| Blackfeet | 0.0 /100 | #298 | Tragic 16.7% |
| Spanish Americans | 0.0 /100 | #299 | Tragic 16.7% |
| U.S. Virgin Islanders | 0.0 /100 | #300 | Tragic 16.7% |
| Immigrants | Congo | 0.0 /100 | #301 | Tragic 16.7% |
| Alaska Natives | 0.0 /100 | #302 | Tragic 16.8% |
| Immigrants | Mexico | 0.0 /100 | #303 | Tragic 16.8% |
| Hondurans | 0.0 /100 | #304 | Tragic 16.9% |
| Immigrants | Cabo Verde | 0.0 /100 | #305 | Tragic 16.9% |
| Chickasaw | 0.0 /100 | #306 | Tragic 17.0% |
| Yaqui | 0.0 /100 | #307 | Tragic 17.0% |
| Africans | 0.0 /100 | #308 | Tragic 17.0% |
| Ottawa | 0.0 /100 | #309 | Tragic 17.1% |