Lebanese vs Romanian Poverty
COMPARE
Lebanese
Romanian
Poverty
Poverty Comparison
Lebanese
Romanians
12.3%
POVERTY
50.0/ 100
METRIC RATING
174th/ 347
METRIC RANK
11.4%
POVERTY
94.9/ 100
METRIC RATING
93rd/ 347
METRIC RANK
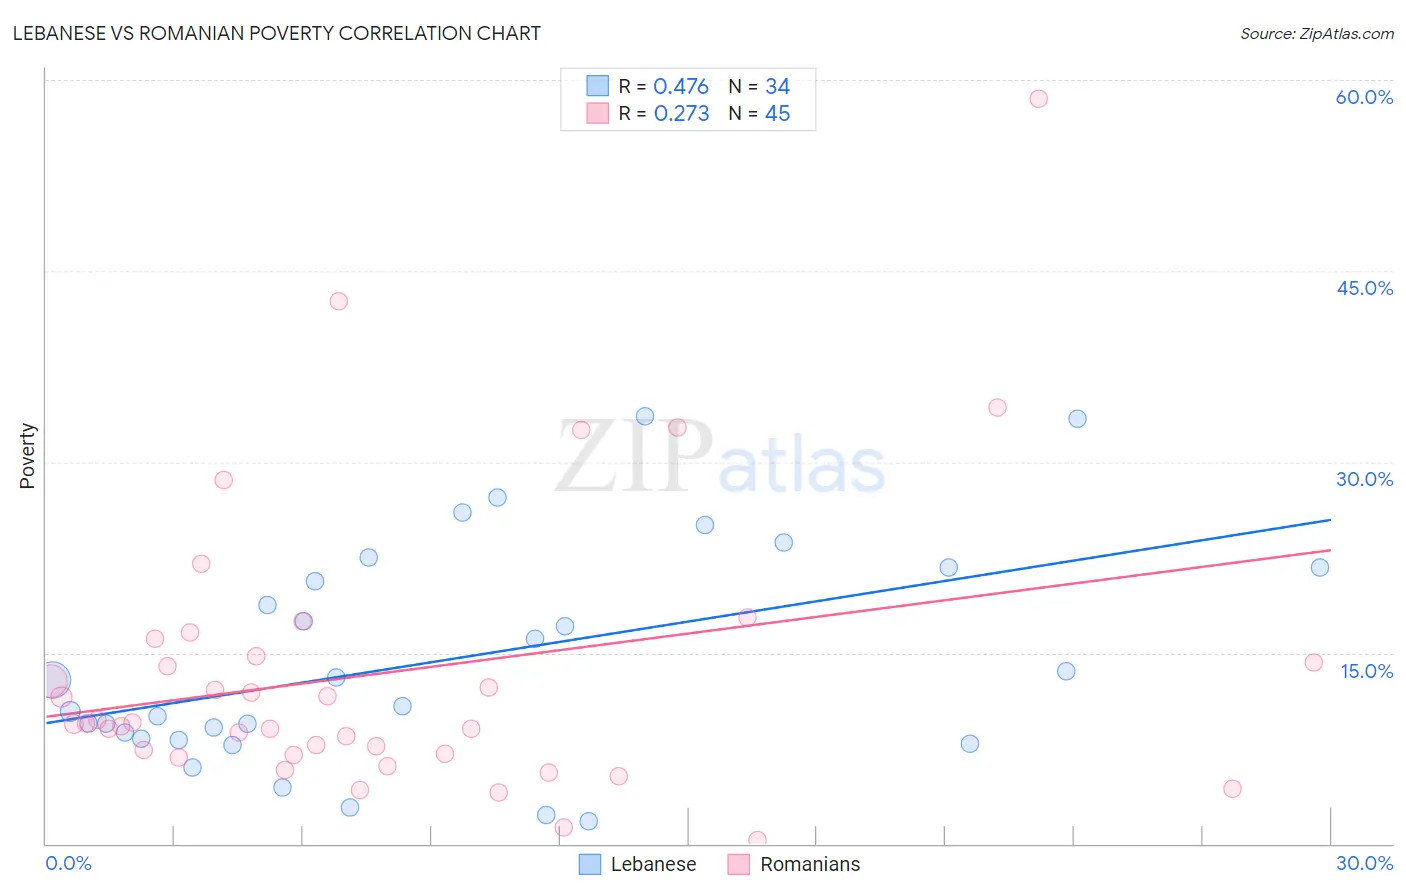
Lebanese vs Romanian Poverty Correlation Chart
The statistical analysis conducted on geographies consisting of 401,338,667 people shows a moderate positive correlation between the proportion of Lebanese and poverty level in the United States with a correlation coefficient (R) of 0.476 and weighted average of 12.3%. Similarly, the statistical analysis conducted on geographies consisting of 377,713,994 people shows a weak positive correlation between the proportion of Romanians and poverty level in the United States with a correlation coefficient (R) of 0.273 and weighted average of 11.4%, a difference of 7.6%.
Poverty Correlation Summary
| Measurement | Lebanese | Romanian |
| Minimum | 1.8% | 0.31% |
| Maximum | 33.6% | 58.5% |
| Range | 31.8% | 58.2% |
| Mean | 14.4% | 13.5% |
| Median | 11.8% | 9.4% |
| Interquartile 25% (IQ1) | 8.3% | 7.0% |
| Interquartile 75% (IQ3) | 21.7% | 15.4% |
| Interquartile Range (IQR) | 13.4% | 8.4% |
| Standard Deviation (Sample) | 8.6% | 11.3% |
| Standard Deviation (Population) | 8.5% | 11.2% |
Similar Demographics by Poverty
Demographics Similar to Lebanese by Poverty
In terms of poverty, the demographic groups most similar to Lebanese are Celtic (12.3%, a difference of 0.010%), Immigrants from Portugal (12.3%, a difference of 0.050%), Immigrants from Spain (12.3%, a difference of 0.12%), South American (12.3%, a difference of 0.13%), and Immigrants from Colombia (12.3%, a difference of 0.23%).
| Demographics | Rating | Rank | Poverty |
| Immigrants | Chile | 56.7 /100 | #167 | Average 12.2% |
| Immigrants | Venezuela | 56.5 /100 | #168 | Average 12.2% |
| Whites/Caucasians | 55.4 /100 | #169 | Average 12.3% |
| Immigrants | Oceania | 54.6 /100 | #170 | Average 12.3% |
| Immigrants | Spain | 51.3 /100 | #171 | Average 12.3% |
| Immigrants | Portugal | 50.5 /100 | #172 | Average 12.3% |
| Celtics | 50.1 /100 | #173 | Average 12.3% |
| Lebanese | 50.0 /100 | #174 | Average 12.3% |
| South Americans | 48.7 /100 | #175 | Average 12.3% |
| Immigrants | Colombia | 47.7 /100 | #176 | Average 12.3% |
| Immigrants | Syria | 47.5 /100 | #177 | Average 12.3% |
| Uruguayans | 44.7 /100 | #178 | Average 12.4% |
| Immigrants | Morocco | 44.0 /100 | #179 | Average 12.4% |
| Mongolians | 43.6 /100 | #180 | Average 12.4% |
| Immigrants | Afghanistan | 42.1 /100 | #181 | Average 12.4% |
Demographics Similar to Romanians by Poverty
In terms of poverty, the demographic groups most similar to Romanians are Paraguayan (11.4%, a difference of 0.020%), Australian (11.4%, a difference of 0.020%), British (11.4%, a difference of 0.030%), Immigrants from South Africa (11.5%, a difference of 0.14%), and Finnish (11.4%, a difference of 0.17%).
| Demographics | Rating | Rank | Poverty |
| Jordanians | 96.0 /100 | #86 | Exceptional 11.4% |
| Northern Europeans | 96.0 /100 | #87 | Exceptional 11.4% |
| Belgians | 95.8 /100 | #88 | Exceptional 11.4% |
| Czechoslovakians | 95.7 /100 | #89 | Exceptional 11.4% |
| Immigrants | Denmark | 95.5 /100 | #90 | Exceptional 11.4% |
| Finns | 95.2 /100 | #91 | Exceptional 11.4% |
| British | 95.0 /100 | #92 | Exceptional 11.4% |
| Romanians | 94.9 /100 | #93 | Exceptional 11.4% |
| Paraguayans | 94.9 /100 | #94 | Exceptional 11.4% |
| Australians | 94.9 /100 | #95 | Exceptional 11.4% |
| Immigrants | South Africa | 94.7 /100 | #96 | Exceptional 11.5% |
| Immigrants | Egypt | 94.6 /100 | #97 | Exceptional 11.5% |
| Immigrants | Latvia | 94.5 /100 | #98 | Exceptional 11.5% |
| Immigrants | Indonesia | 94.2 /100 | #99 | Exceptional 11.5% |
| Scottish | 94.0 /100 | #100 | Exceptional 11.5% |