Immigrants from South America vs Cambodian Family Poverty
COMPARE
Immigrants from South America
Cambodian
Family Poverty
Family Poverty Comparison
Immigrants from South America
Cambodians
9.5%
FAMILY POVERTY
18.0/ 100
METRIC RATING
206th/ 347
METRIC RANK
7.8%
FAMILY POVERTY
98.2/ 100
METRIC RATING
71st/ 347
METRIC RANK
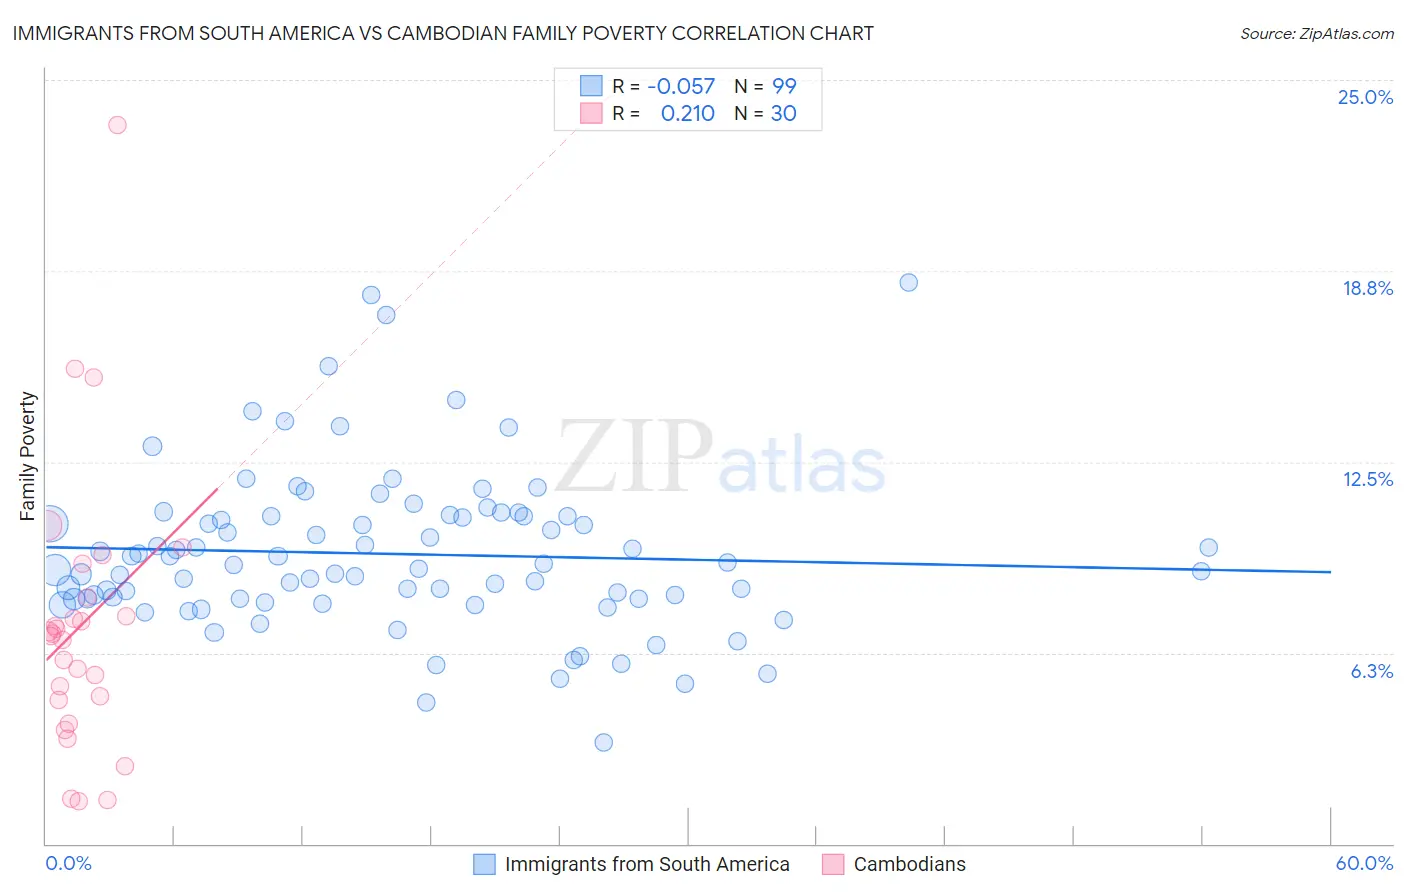
Immigrants from South America vs Cambodian Family Poverty Correlation Chart
The statistical analysis conducted on geographies consisting of 484,267,691 people shows a slight negative correlation between the proportion of Immigrants from South America and poverty level among families in the United States with a correlation coefficient (R) of -0.057 and weighted average of 9.5%. Similarly, the statistical analysis conducted on geographies consisting of 102,420,102 people shows a weak positive correlation between the proportion of Cambodians and poverty level among families in the United States with a correlation coefficient (R) of 0.210 and weighted average of 7.8%, a difference of 20.8%.
Family Poverty Correlation Summary
| Measurement | Immigrants from South America | Cambodian |
| Minimum | 3.3% | 1.4% |
| Maximum | 18.4% | 23.5% |
| Range | 15.1% | 22.1% |
| Mean | 9.5% | 7.2% |
| Median | 9.1% | 6.8% |
| Interquartile 25% (IQ1) | 8.0% | 4.7% |
| Interquartile 75% (IQ3) | 10.7% | 8.0% |
| Interquartile Range (IQR) | 2.7% | 3.3% |
| Standard Deviation (Sample) | 2.6% | 4.6% |
| Standard Deviation (Population) | 2.6% | 4.5% |
Similar Demographics by Family Poverty
Demographics Similar to Immigrants from South America by Family Poverty
In terms of family poverty, the demographic groups most similar to Immigrants from South America are Aleut (9.5%, a difference of 0.010%), Immigrants from Lebanon (9.4%, a difference of 0.20%), German Russian (9.4%, a difference of 0.30%), Immigrants from Sierra Leone (9.4%, a difference of 0.34%), and Immigrants from Portugal (9.4%, a difference of 0.52%).
| Demographics | Rating | Rank | Family Poverty |
| Spaniards | 22.8 /100 | #199 | Fair 9.4% |
| Immigrants | Costa Rica | 21.7 /100 | #200 | Fair 9.4% |
| Immigrants | Portugal | 20.5 /100 | #201 | Fair 9.4% |
| Immigrants | Sierra Leone | 19.6 /100 | #202 | Poor 9.4% |
| German Russians | 19.4 /100 | #203 | Poor 9.4% |
| Immigrants | Lebanon | 18.9 /100 | #204 | Poor 9.4% |
| Aleuts | 18.0 /100 | #205 | Poor 9.5% |
| Immigrants | South America | 18.0 /100 | #206 | Poor 9.5% |
| Sierra Leoneans | 15.6 /100 | #207 | Poor 9.5% |
| Immigrants | Eastern Africa | 15.1 /100 | #208 | Poor 9.5% |
| Immigrants | Uruguay | 14.0 /100 | #209 | Poor 9.5% |
| Alsatians | 11.3 /100 | #210 | Poor 9.6% |
| Malaysians | 10.6 /100 | #211 | Poor 9.6% |
| Immigrants | Thailand | 9.7 /100 | #212 | Tragic 9.7% |
| Osage | 8.0 /100 | #213 | Tragic 9.7% |
Demographics Similar to Cambodians by Family Poverty
In terms of family poverty, the demographic groups most similar to Cambodians are Immigrants from Canada (7.8%, a difference of 0.020%), Immigrants from Belgium (7.8%, a difference of 0.060%), Immigrants from Romania (7.8%, a difference of 0.060%), Austrian (7.8%, a difference of 0.060%), and Australian (7.8%, a difference of 0.070%).
| Demographics | Rating | Rank | Family Poverty |
| Koreans | 98.3 /100 | #64 | Exceptional 7.8% |
| Immigrants | Bulgaria | 98.3 /100 | #65 | Exceptional 7.8% |
| Dutch | 98.3 /100 | #66 | Exceptional 7.8% |
| Northern Europeans | 98.3 /100 | #67 | Exceptional 7.8% |
| Australians | 98.2 /100 | #68 | Exceptional 7.8% |
| Immigrants | Belgium | 98.2 /100 | #69 | Exceptional 7.8% |
| Immigrants | Canada | 98.2 /100 | #70 | Exceptional 7.8% |
| Cambodians | 98.2 /100 | #71 | Exceptional 7.8% |
| Immigrants | Romania | 98.2 /100 | #72 | Exceptional 7.8% |
| Austrians | 98.2 /100 | #73 | Exceptional 7.8% |
| Immigrants | China | 98.1 /100 | #74 | Exceptional 7.8% |
| Immigrants | Croatia | 98.1 /100 | #75 | Exceptional 7.8% |
| Immigrants | Latvia | 98.0 /100 | #76 | Exceptional 7.9% |
| Ukrainians | 98.0 /100 | #77 | Exceptional 7.9% |
| Immigrants | North America | 97.9 /100 | #78 | Exceptional 7.9% |