Immigrants from Somalia vs Trinidadian and Tobagonian Unemployment Among Women with Children Ages 6 to 17 years
COMPARE
Immigrants from Somalia
Trinidadian and Tobagonian
Unemployment Among Women with Children Ages 6 to 17 years
Unemployment Among Women with Children Ages 6 to 17 years Comparison
Immigrants from Somalia
Trinidadians and Tobagonians
8.0%
UNEMPLOYMENT AMONG WOMEN WITH CHILDREN AGES 6 TO 17 YEARS
100.0/ 100
METRIC RATING
42nd/ 347
METRIC RANK
9.1%
UNEMPLOYMENT AMONG WOMEN WITH CHILDREN AGES 6 TO 17 YEARS
18.2/ 100
METRIC RATING
200th/ 347
METRIC RANK
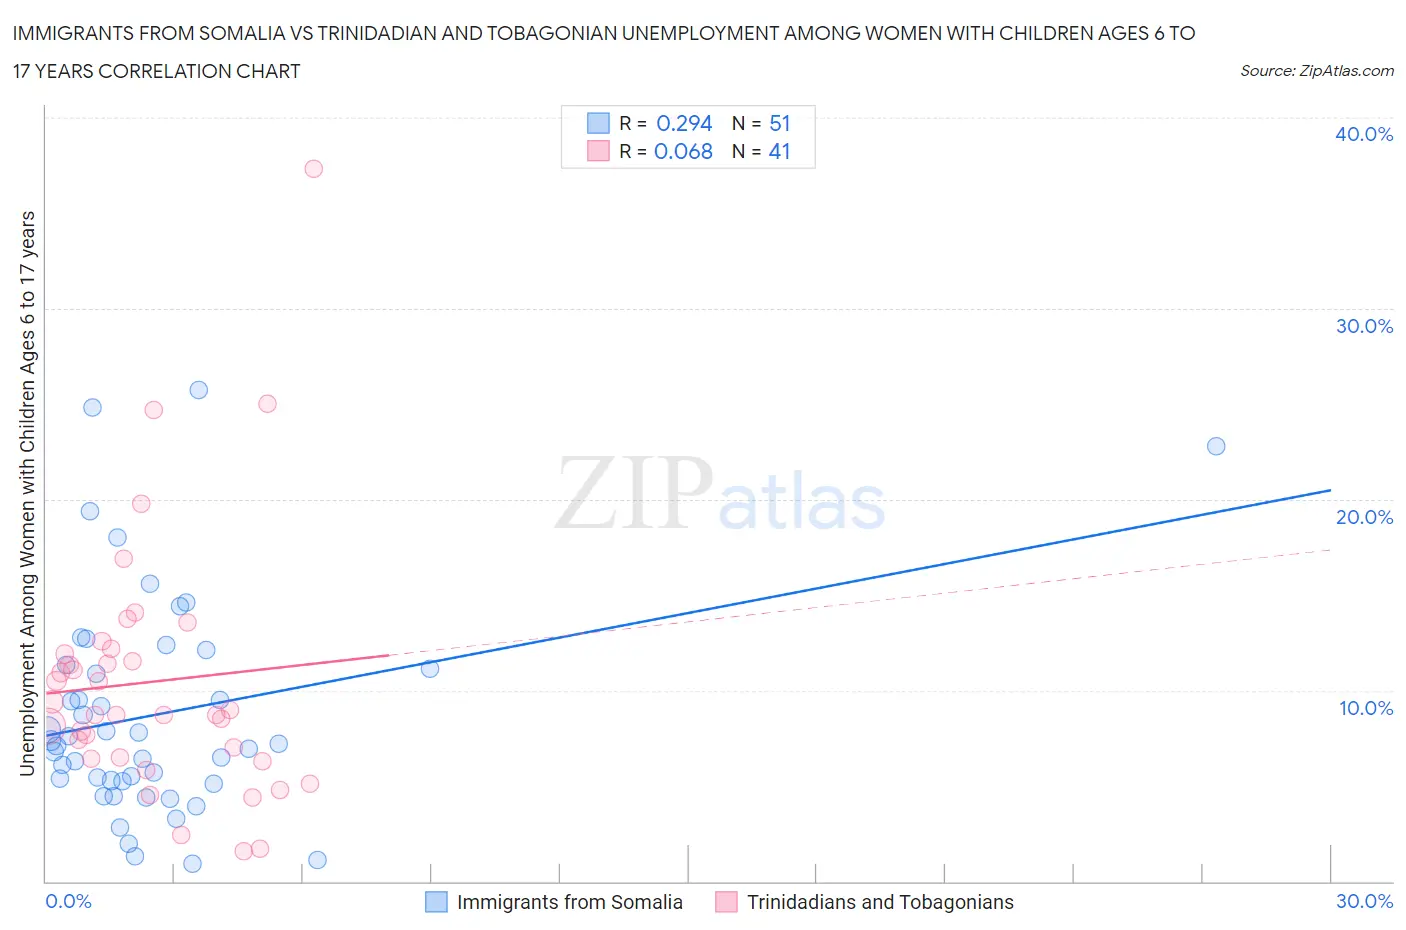
Immigrants from Somalia vs Trinidadian and Tobagonian Unemployment Among Women with Children Ages 6 to 17 years Correlation Chart
The statistical analysis conducted on geographies consisting of 81,291,755 people shows a weak positive correlation between the proportion of Immigrants from Somalia and unemployment rate among women with children between the ages 6 and 17 in the United States with a correlation coefficient (R) of 0.294 and weighted average of 8.0%. Similarly, the statistical analysis conducted on geographies consisting of 177,682,071 people shows a slight positive correlation between the proportion of Trinidadians and Tobagonians and unemployment rate among women with children between the ages 6 and 17 in the United States with a correlation coefficient (R) of 0.068 and weighted average of 9.1%, a difference of 13.3%.
Unemployment Among Women with Children Ages 6 to 17 years Correlation Summary
| Measurement | Immigrants from Somalia | Trinidadian and Tobagonian |
| Minimum | 0.90% | 1.6% |
| Maximum | 25.7% | 37.3% |
| Range | 24.8% | 35.7% |
| Mean | 8.8% | 10.4% |
| Median | 7.2% | 8.7% |
| Interquartile 25% (IQ1) | 5.2% | 6.4% |
| Interquartile 75% (IQ3) | 11.3% | 12.0% |
| Interquartile Range (IQR) | 6.1% | 5.6% |
| Standard Deviation (Sample) | 5.7% | 6.7% |
| Standard Deviation (Population) | 5.7% | 6.6% |
Similar Demographics by Unemployment Among Women with Children Ages 6 to 17 years
Demographics Similar to Immigrants from Somalia by Unemployment Among Women with Children Ages 6 to 17 years
In terms of unemployment among women with children ages 6 to 17 years, the demographic groups most similar to Immigrants from Somalia are Bhutanese (8.1%, a difference of 0.14%), Immigrants from Sweden (8.1%, a difference of 0.18%), Immigrants from Bulgaria (8.1%, a difference of 0.22%), Icelander (8.1%, a difference of 0.24%), and Iranian (8.0%, a difference of 0.27%).
| Demographics | Rating | Rank | Unemployment Among Women with Children Ages 6 to 17 years |
| Immigrants | South Central Asia | 100.0 /100 | #35 | Exceptional 7.9% |
| Burmese | 100.0 /100 | #36 | Exceptional 8.0% |
| Asians | 100.0 /100 | #37 | Exceptional 8.0% |
| Alsatians | 100.0 /100 | #38 | Exceptional 8.0% |
| Somalis | 100.0 /100 | #39 | Exceptional 8.0% |
| Immigrants | Zimbabwe | 100.0 /100 | #40 | Exceptional 8.0% |
| Iranians | 100.0 /100 | #41 | Exceptional 8.0% |
| Immigrants | Somalia | 100.0 /100 | #42 | Exceptional 8.0% |
| Bhutanese | 100.0 /100 | #43 | Exceptional 8.1% |
| Immigrants | Sweden | 100.0 /100 | #44 | Exceptional 8.1% |
| Immigrants | Bulgaria | 100.0 /100 | #45 | Exceptional 8.1% |
| Icelanders | 100.0 /100 | #46 | Exceptional 8.1% |
| Immigrants | Switzerland | 100.0 /100 | #47 | Exceptional 8.1% |
| Immigrants | Asia | 100.0 /100 | #48 | Exceptional 8.1% |
| Immigrants | Oceania | 100.0 /100 | #49 | Exceptional 8.1% |
Demographics Similar to Trinidadians and Tobagonians by Unemployment Among Women with Children Ages 6 to 17 years
In terms of unemployment among women with children ages 6 to 17 years, the demographic groups most similar to Trinidadians and Tobagonians are Immigrants from Trinidad and Tobago (9.1%, a difference of 0.11%), Czechoslovakian (9.1%, a difference of 0.18%), Immigrants from Middle Africa (9.1%, a difference of 0.20%), Maltese (9.1%, a difference of 0.22%), and Immigrants from Canada (9.1%, a difference of 0.23%).
| Demographics | Rating | Rank | Unemployment Among Women with Children Ages 6 to 17 years |
| Immigrants | Turkey | 25.8 /100 | #193 | Fair 9.1% |
| Immigrants | Kazakhstan | 25.3 /100 | #194 | Fair 9.1% |
| Austrians | 25.0 /100 | #195 | Fair 9.1% |
| Brazilians | 24.4 /100 | #196 | Fair 9.1% |
| Immigrants | Panama | 24.3 /100 | #197 | Fair 9.1% |
| Guyanese | 21.8 /100 | #198 | Fair 9.1% |
| Czechoslovakians | 20.8 /100 | #199 | Fair 9.1% |
| Trinidadians and Tobagonians | 18.2 /100 | #200 | Poor 9.1% |
| Immigrants | Trinidad and Tobago | 16.7 /100 | #201 | Poor 9.1% |
| Immigrants | Middle Africa | 15.6 /100 | #202 | Poor 9.1% |
| Maltese | 15.3 /100 | #203 | Poor 9.1% |
| Immigrants | Canada | 15.3 /100 | #204 | Poor 9.1% |
| Immigrants | Western Europe | 14.1 /100 | #205 | Poor 9.1% |
| Immigrants | North America | 12.7 /100 | #206 | Poor 9.2% |
| Cubans | 10.9 /100 | #207 | Poor 9.2% |