Immigrants from Somalia vs French American Indian Female Poverty Among 18-24 Year Olds
COMPARE
Immigrants from Somalia
French American Indian
Female Poverty Among 18-24 Year Olds
Female Poverty Among 18-24 Year Olds Comparison
Immigrants from Somalia
French American Indians
25.7%
FEMALE POVERTY AMONG 18-24 YEAR OLDS
0.0/ 100
METRIC RATING
330th/ 347
METRIC RANK
22.3%
FEMALE POVERTY AMONG 18-24 YEAR OLDS
0.0/ 100
METRIC RATING
289th/ 347
METRIC RANK
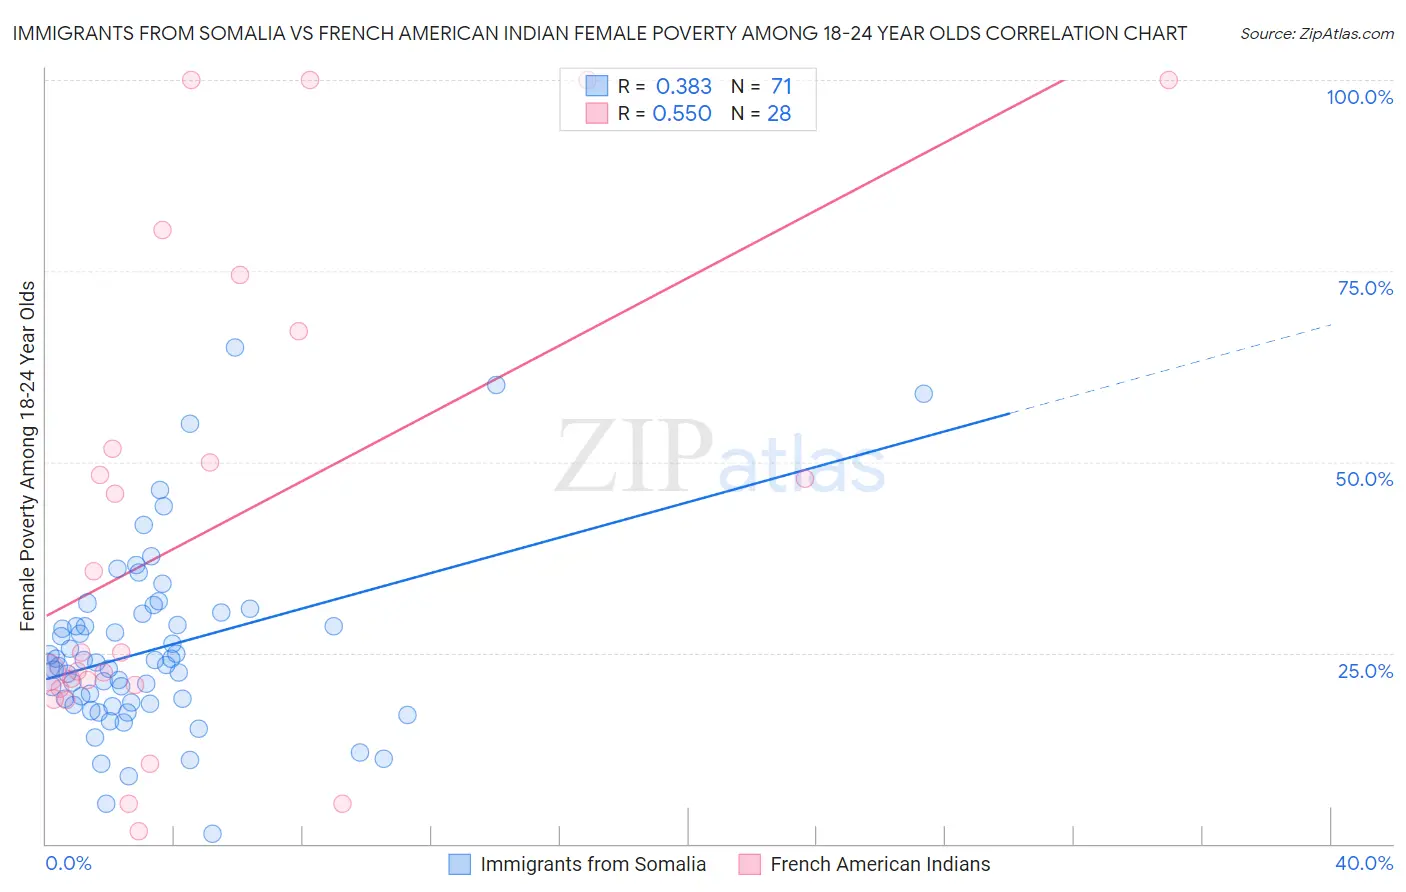
Immigrants from Somalia vs French American Indian Female Poverty Among 18-24 Year Olds Correlation Chart
The statistical analysis conducted on geographies consisting of 91,805,813 people shows a mild positive correlation between the proportion of Immigrants from Somalia and poverty level among females between the ages 18 and 24 in the United States with a correlation coefficient (R) of 0.383 and weighted average of 25.7%. Similarly, the statistical analysis conducted on geographies consisting of 130,637,035 people shows a substantial positive correlation between the proportion of French American Indians and poverty level among females between the ages 18 and 24 in the United States with a correlation coefficient (R) of 0.550 and weighted average of 22.3%, a difference of 15.6%.
Female Poverty Among 18-24 Year Olds Correlation Summary
| Measurement | Immigrants from Somalia | French American Indian |
| Minimum | 1.4% | 1.6% |
| Maximum | 65.0% | 100.0% |
| Range | 63.6% | 98.4% |
| Mean | 25.5% | 41.6% |
| Median | 23.4% | 25.1% |
| Interquartile 25% (IQ1) | 18.3% | 20.6% |
| Interquartile 75% (IQ3) | 30.1% | 59.4% |
| Interquartile Range (IQR) | 11.8% | 38.8% |
| Standard Deviation (Sample) | 11.9% | 31.5% |
| Standard Deviation (Population) | 11.8% | 30.9% |
Similar Demographics by Female Poverty Among 18-24 Year Olds
Demographics Similar to Immigrants from Somalia by Female Poverty Among 18-24 Year Olds
In terms of female poverty among 18-24 year olds, the demographic groups most similar to Immigrants from Somalia are Cajun (25.7%, a difference of 0.21%), Chippewa (25.9%, a difference of 0.65%), Native/Alaskan (25.4%, a difference of 1.3%), Ute (25.4%, a difference of 1.4%), and Yakama (25.3%, a difference of 1.6%).
| Demographics | Rating | Rank | Female Poverty Among 18-24 Year Olds |
| Arapaho | 0.0 /100 | #323 | Tragic 25.2% |
| German Russians | 0.0 /100 | #324 | Tragic 25.2% |
| Immigrants | Saudi Arabia | 0.0 /100 | #325 | Tragic 25.3% |
| Yakama | 0.0 /100 | #326 | Tragic 25.3% |
| Ute | 0.0 /100 | #327 | Tragic 25.4% |
| Natives/Alaskans | 0.0 /100 | #328 | Tragic 25.4% |
| Cajuns | 0.0 /100 | #329 | Tragic 25.7% |
| Immigrants | Somalia | 0.0 /100 | #330 | Tragic 25.7% |
| Chippewa | 0.0 /100 | #331 | Tragic 25.9% |
| Houma | 0.0 /100 | #332 | Tragic 26.2% |
| Apache | 0.0 /100 | #333 | Tragic 26.3% |
| Pueblo | 0.0 /100 | #334 | Tragic 26.9% |
| Yup'ik | 0.0 /100 | #335 | Tragic 27.0% |
| Immigrants | Yemen | 0.0 /100 | #336 | Tragic 27.5% |
| Cheyenne | 0.0 /100 | #337 | Tragic 28.1% |
Demographics Similar to French American Indians by Female Poverty Among 18-24 Year Olds
In terms of female poverty among 18-24 year olds, the demographic groups most similar to French American Indians are Dominican (22.3%, a difference of 0.070%), Immigrants from Senegal (22.4%, a difference of 0.58%), Immigrants from Middle Africa (22.1%, a difference of 0.83%), Ugandan (22.1%, a difference of 0.84%), and Bangladeshi (22.5%, a difference of 0.86%).
| Demographics | Rating | Rank | Female Poverty Among 18-24 Year Olds |
| Bermudans | 0.1 /100 | #282 | Tragic 21.9% |
| Sub-Saharan Africans | 0.0 /100 | #283 | Tragic 22.0% |
| Tlingit-Haida | 0.0 /100 | #284 | Tragic 22.0% |
| Ottawa | 0.0 /100 | #285 | Tragic 22.0% |
| Ugandans | 0.0 /100 | #286 | Tragic 22.1% |
| Immigrants | Middle Africa | 0.0 /100 | #287 | Tragic 22.1% |
| Dominicans | 0.0 /100 | #288 | Tragic 22.3% |
| French American Indians | 0.0 /100 | #289 | Tragic 22.3% |
| Immigrants | Senegal | 0.0 /100 | #290 | Tragic 22.4% |
| Bangladeshis | 0.0 /100 | #291 | Tragic 22.5% |
| Alaskan Athabascans | 0.0 /100 | #292 | Tragic 22.5% |
| U.S. Virgin Islanders | 0.0 /100 | #293 | Tragic 22.5% |
| Indonesians | 0.0 /100 | #294 | Tragic 22.5% |
| Shoshone | 0.0 /100 | #295 | Tragic 22.5% |
| Menominee | 0.0 /100 | #296 | Tragic 22.5% |