Immigrants from France vs Immigrants from Burma/Myanmar Female Poverty Among 18-24 Year Olds
COMPARE
Immigrants from France
Immigrants from Burma/Myanmar
Female Poverty Among 18-24 Year Olds
Female Poverty Among 18-24 Year Olds Comparison
Immigrants from France
Immigrants from Burma/Myanmar
21.4%
FEMALE POVERTY AMONG 18-24 YEAR OLDS
0.6/ 100
METRIC RATING
259th/ 347
METRIC RANK
21.6%
FEMALE POVERTY AMONG 18-24 YEAR OLDS
0.2/ 100
METRIC RATING
268th/ 347
METRIC RANK
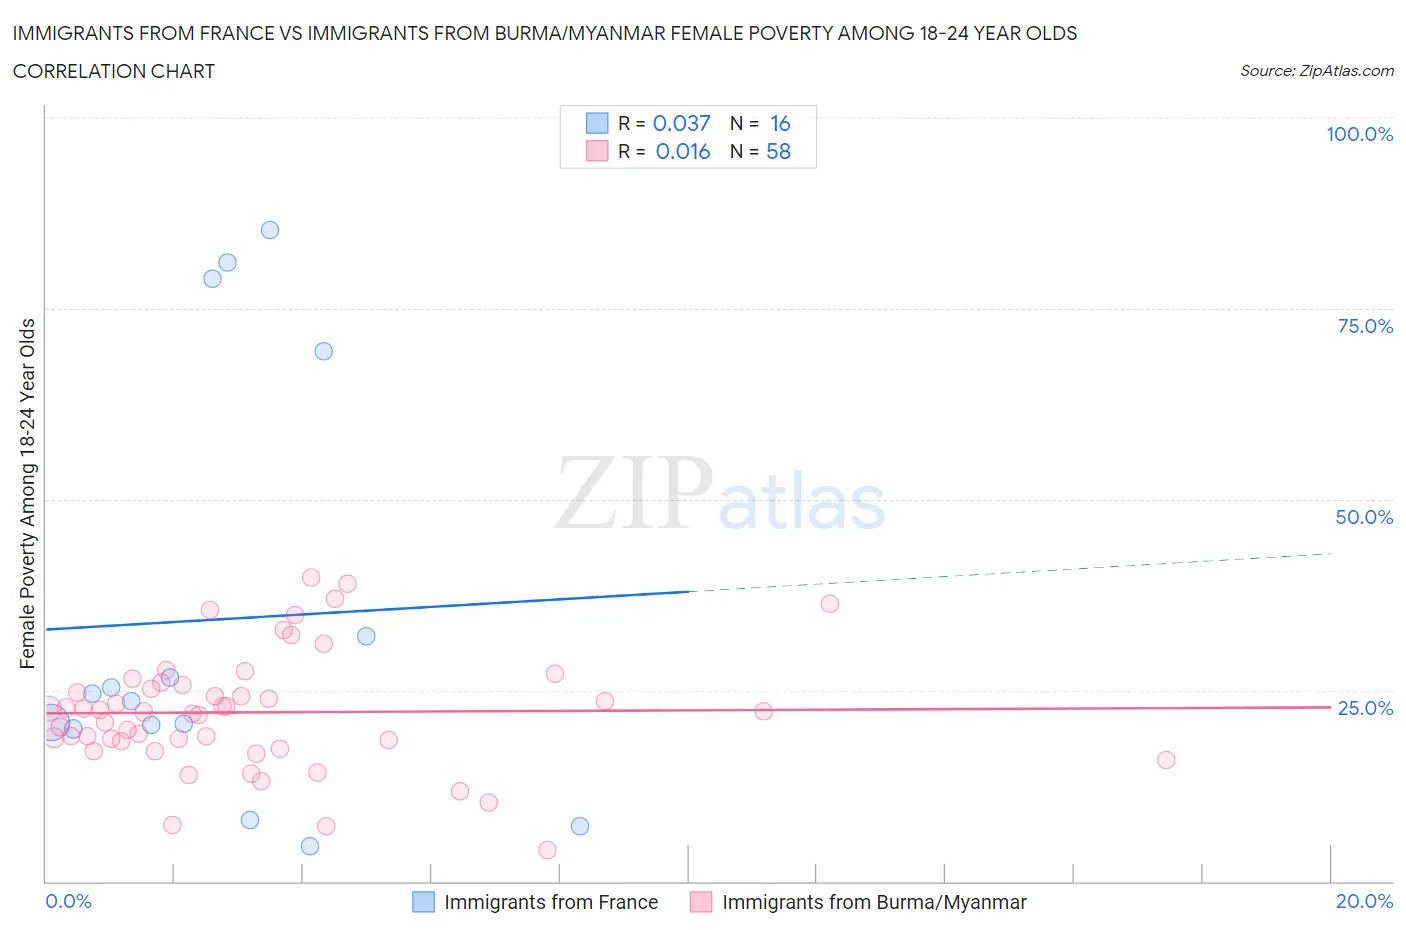
Immigrants from France vs Immigrants from Burma/Myanmar Female Poverty Among 18-24 Year Olds Correlation Chart
The statistical analysis conducted on geographies consisting of 282,438,656 people shows no correlation between the proportion of Immigrants from France and poverty level among females between the ages 18 and 24 in the United States with a correlation coefficient (R) of 0.037 and weighted average of 21.4%. Similarly, the statistical analysis conducted on geographies consisting of 170,928,474 people shows no correlation between the proportion of Immigrants from Burma/Myanmar and poverty level among females between the ages 18 and 24 in the United States with a correlation coefficient (R) of 0.016 and weighted average of 21.6%, a difference of 1.0%.
Female Poverty Among 18-24 Year Olds Correlation Summary
| Measurement | Immigrants from France | Immigrants from Burma/Myanmar |
| Minimum | 4.7% | 4.1% |
| Maximum | 85.2% | 39.8% |
| Range | 80.6% | 35.7% |
| Mean | 34.3% | 22.1% |
| Median | 24.1% | 22.2% |
| Interquartile 25% (IQ1) | 20.2% | 18.4% |
| Interquartile 75% (IQ3) | 50.8% | 25.6% |
| Interquartile Range (IQR) | 30.6% | 7.2% |
| Standard Deviation (Sample) | 27.6% | 7.7% |
| Standard Deviation (Population) | 26.7% | 7.6% |
Demographics Similar to Immigrants from France and Immigrants from Burma/Myanmar by Female Poverty Among 18-24 Year Olds
In terms of female poverty among 18-24 year olds, the demographic groups most similar to Immigrants from France are Vietnamese (21.4%, a difference of 0.030%), Immigrants from Norway (21.4%, a difference of 0.050%), Immigrants from Bahamas (21.4%, a difference of 0.12%), Immigrants from Eastern Africa (21.4%, a difference of 0.31%), and Taiwanese (21.2%, a difference of 0.57%). Similarly, the demographic groups most similar to Immigrants from Burma/Myanmar are Celtic (21.6%, a difference of 0.060%), Mongolian (21.6%, a difference of 0.090%), Scotch-Irish (21.6%, a difference of 0.10%), American (21.6%, a difference of 0.15%), and Alaska Native (21.5%, a difference of 0.23%).
| Demographics | Rating | Rank | Female Poverty Among 18-24 Year Olds |
| Delaware | 1.6 /100 | #253 | Tragic 21.1% |
| British West Indians | 1.2 /100 | #254 | Tragic 21.2% |
| Immigrants | Grenada | 1.2 /100 | #255 | Tragic 21.2% |
| Tsimshian | 1.0 /100 | #256 | Tragic 21.2% |
| Taiwanese | 1.0 /100 | #257 | Tragic 21.2% |
| Vietnamese | 0.6 /100 | #258 | Tragic 21.4% |
| Immigrants | France | 0.6 /100 | #259 | Tragic 21.4% |
| Immigrants | Norway | 0.6 /100 | #260 | Tragic 21.4% |
| Immigrants | Bahamas | 0.5 /100 | #261 | Tragic 21.4% |
| Immigrants | Eastern Africa | 0.4 /100 | #262 | Tragic 21.4% |
| Icelanders | 0.3 /100 | #263 | Tragic 21.5% |
| Hondurans | 0.3 /100 | #264 | Tragic 21.5% |
| Immigrants | Nonimmigrants | 0.3 /100 | #265 | Tragic 21.5% |
| Alaska Natives | 0.3 /100 | #266 | Tragic 21.5% |
| Americans | 0.3 /100 | #267 | Tragic 21.6% |
| Immigrants | Burma/Myanmar | 0.2 /100 | #268 | Tragic 21.6% |
| Celtics | 0.2 /100 | #269 | Tragic 21.6% |
| Mongolians | 0.2 /100 | #270 | Tragic 21.6% |
| Scotch-Irish | 0.2 /100 | #271 | Tragic 21.6% |
| Basques | 0.2 /100 | #272 | Tragic 21.7% |
| New Zealanders | 0.2 /100 | #273 | Tragic 21.7% |