Immigrants from Guatemala vs Immigrants from Burma/Myanmar Female Poverty Among 18-24 Year Olds
COMPARE
Immigrants from Guatemala
Immigrants from Burma/Myanmar
Female Poverty Among 18-24 Year Olds
Female Poverty Among 18-24 Year Olds Comparison
Immigrants from Guatemala
Immigrants from Burma/Myanmar
20.9%
FEMALE POVERTY AMONG 18-24 YEAR OLDS
4.3/ 100
METRIC RATING
239th/ 347
METRIC RANK
21.6%
FEMALE POVERTY AMONG 18-24 YEAR OLDS
0.2/ 100
METRIC RATING
268th/ 347
METRIC RANK
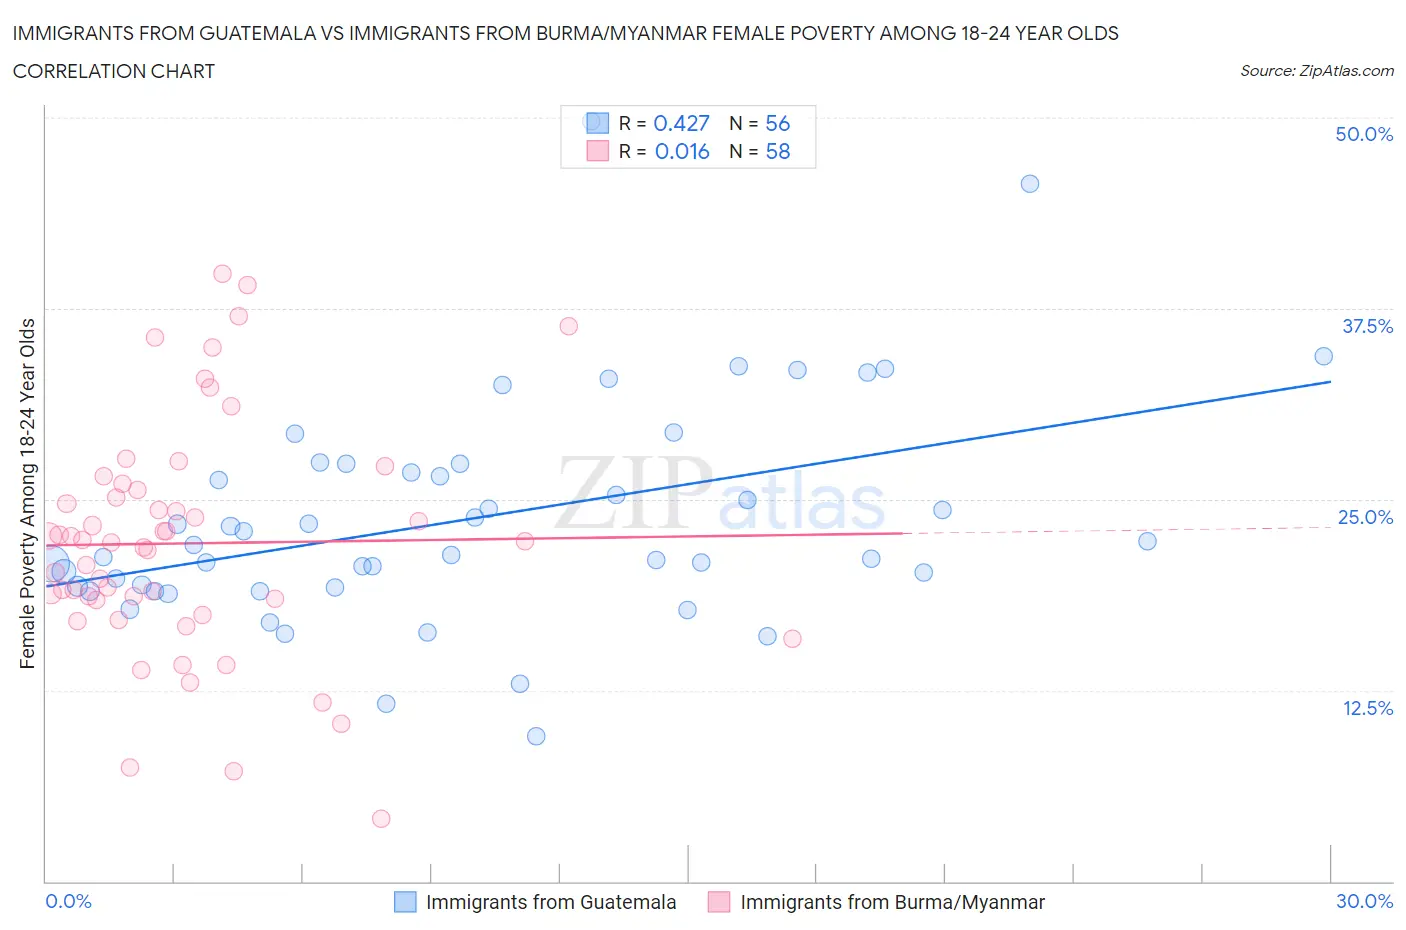
Immigrants from Guatemala vs Immigrants from Burma/Myanmar Female Poverty Among 18-24 Year Olds Correlation Chart
The statistical analysis conducted on geographies consisting of 370,396,401 people shows a moderate positive correlation between the proportion of Immigrants from Guatemala and poverty level among females between the ages 18 and 24 in the United States with a correlation coefficient (R) of 0.427 and weighted average of 20.9%. Similarly, the statistical analysis conducted on geographies consisting of 170,928,474 people shows no correlation between the proportion of Immigrants from Burma/Myanmar and poverty level among females between the ages 18 and 24 in the United States with a correlation coefficient (R) of 0.016 and weighted average of 21.6%, a difference of 3.5%.
Female Poverty Among 18-24 Year Olds Correlation Summary
| Measurement | Immigrants from Guatemala | Immigrants from Burma/Myanmar |
| Minimum | 9.5% | 4.1% |
| Maximum | 49.8% | 39.8% |
| Range | 40.3% | 35.7% |
| Mean | 23.7% | 22.1% |
| Median | 21.7% | 22.2% |
| Interquartile 25% (IQ1) | 19.3% | 18.4% |
| Interquartile 75% (IQ3) | 27.1% | 25.6% |
| Interquartile Range (IQR) | 7.8% | 7.2% |
| Standard Deviation (Sample) | 7.3% | 7.7% |
| Standard Deviation (Population) | 7.3% | 7.6% |
Similar Demographics by Female Poverty Among 18-24 Year Olds
Demographics Similar to Immigrants from Guatemala by Female Poverty Among 18-24 Year Olds
In terms of female poverty among 18-24 year olds, the demographic groups most similar to Immigrants from Guatemala are Immigrants from Singapore (20.9%, a difference of 0.010%), Luxembourger (20.9%, a difference of 0.030%), Immigrants from Eritrea (20.9%, a difference of 0.040%), Scottish (20.9%, a difference of 0.050%), and Israeli (20.9%, a difference of 0.050%).
| Demographics | Rating | Rank | Female Poverty Among 18-24 Year Olds |
| Finns | 6.0 /100 | #232 | Tragic 20.8% |
| Immigrants | Denmark | 5.8 /100 | #233 | Tragic 20.8% |
| Welsh | 5.4 /100 | #234 | Tragic 20.8% |
| Immigrants | Uganda | 5.1 /100 | #235 | Tragic 20.8% |
| Okinawans | 4.9 /100 | #236 | Tragic 20.8% |
| Scottish | 4.5 /100 | #237 | Tragic 20.9% |
| Immigrants | Singapore | 4.4 /100 | #238 | Tragic 20.9% |
| Immigrants | Guatemala | 4.3 /100 | #239 | Tragic 20.9% |
| Luxembourgers | 4.2 /100 | #240 | Tragic 20.9% |
| Immigrants | Eritrea | 4.2 /100 | #241 | Tragic 20.9% |
| Israelis | 4.1 /100 | #242 | Tragic 20.9% |
| Marshallese | 3.4 /100 | #243 | Tragic 20.9% |
| Immigrants | Thailand | 3.4 /100 | #244 | Tragic 20.9% |
| Aleuts | 3.3 /100 | #245 | Tragic 20.9% |
| Immigrants | Australia | 3.1 /100 | #246 | Tragic 20.9% |
Demographics Similar to Immigrants from Burma/Myanmar by Female Poverty Among 18-24 Year Olds
In terms of female poverty among 18-24 year olds, the demographic groups most similar to Immigrants from Burma/Myanmar are Celtic (21.6%, a difference of 0.060%), Mongolian (21.6%, a difference of 0.090%), Scotch-Irish (21.6%, a difference of 0.10%), American (21.6%, a difference of 0.15%), and Alaska Native (21.5%, a difference of 0.23%).
| Demographics | Rating | Rank | Female Poverty Among 18-24 Year Olds |
| Immigrants | Bahamas | 0.5 /100 | #261 | Tragic 21.4% |
| Immigrants | Eastern Africa | 0.4 /100 | #262 | Tragic 21.4% |
| Icelanders | 0.3 /100 | #263 | Tragic 21.5% |
| Hondurans | 0.3 /100 | #264 | Tragic 21.5% |
| Immigrants | Nonimmigrants | 0.3 /100 | #265 | Tragic 21.5% |
| Alaska Natives | 0.3 /100 | #266 | Tragic 21.5% |
| Americans | 0.3 /100 | #267 | Tragic 21.6% |
| Immigrants | Burma/Myanmar | 0.2 /100 | #268 | Tragic 21.6% |
| Celtics | 0.2 /100 | #269 | Tragic 21.6% |
| Mongolians | 0.2 /100 | #270 | Tragic 21.6% |
| Scotch-Irish | 0.2 /100 | #271 | Tragic 21.6% |
| Basques | 0.2 /100 | #272 | Tragic 21.7% |
| New Zealanders | 0.2 /100 | #273 | Tragic 21.7% |
| Immigrants | Honduras | 0.1 /100 | #274 | Tragic 21.8% |
| Immigrants | Bangladesh | 0.1 /100 | #275 | Tragic 21.8% |