Immigrants from Somalia vs Japanese Single Mother Poverty
COMPARE
Immigrants from Somalia
Japanese
Single Mother Poverty
Single Mother Poverty Comparison
Immigrants from Somalia
Japanese
33.4%
SINGLE MOTHER POVERTY
0.0/ 100
METRIC RATING
301st/ 347
METRIC RANK
28.9%
SINGLE MOTHER POVERTY
68.0/ 100
METRIC RATING
160th/ 347
METRIC RANK
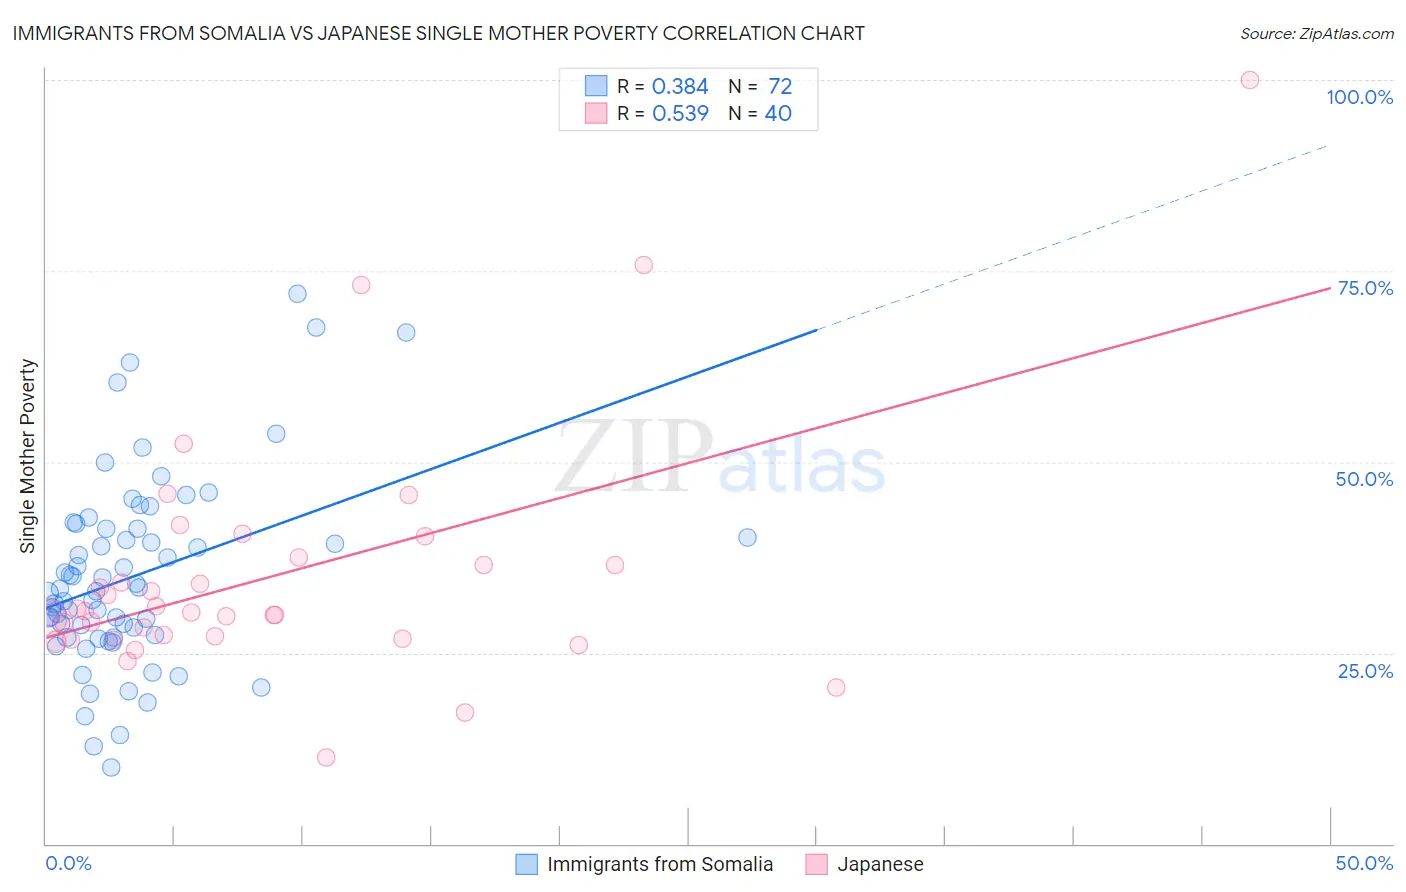
Immigrants from Somalia vs Japanese Single Mother Poverty Correlation Chart
The statistical analysis conducted on geographies consisting of 91,810,835 people shows a mild positive correlation between the proportion of Immigrants from Somalia and poverty level among single mothers in the United States with a correlation coefficient (R) of 0.384 and weighted average of 33.4%. Similarly, the statistical analysis conducted on geographies consisting of 246,409,359 people shows a substantial positive correlation between the proportion of Japanese and poverty level among single mothers in the United States with a correlation coefficient (R) of 0.539 and weighted average of 28.9%, a difference of 15.5%.
Single Mother Poverty Correlation Summary
| Measurement | Immigrants from Somalia | Japanese |
| Minimum | 10.0% | 11.3% |
| Maximum | 72.0% | 100.0% |
| Range | 62.0% | 88.7% |
| Mean | 35.0% | 35.2% |
| Median | 33.2% | 30.4% |
| Interquartile 25% (IQ1) | 27.2% | 27.0% |
| Interquartile 75% (IQ3) | 41.2% | 37.0% |
| Interquartile Range (IQR) | 14.0% | 10.0% |
| Standard Deviation (Sample) | 12.5% | 16.1% |
| Standard Deviation (Population) | 12.4% | 15.9% |
Similar Demographics by Single Mother Poverty
Demographics Similar to Immigrants from Somalia by Single Mother Poverty
In terms of single mother poverty, the demographic groups most similar to Immigrants from Somalia are Arapaho (33.4%, a difference of 0.15%), Hispanic or Latino (33.3%, a difference of 0.24%), Immigrants from Guatemala (33.3%, a difference of 0.25%), African (33.3%, a difference of 0.33%), and American (33.5%, a difference of 0.41%).
| Demographics | Rating | Rank | Single Mother Poverty |
| French American Indians | 0.0 /100 | #294 | Tragic 33.1% |
| Yaqui | 0.0 /100 | #295 | Tragic 33.1% |
| Blackfeet | 0.0 /100 | #296 | Tragic 33.2% |
| Pennsylvania Germans | 0.0 /100 | #297 | Tragic 33.2% |
| Africans | 0.0 /100 | #298 | Tragic 33.3% |
| Immigrants | Guatemala | 0.0 /100 | #299 | Tragic 33.3% |
| Hispanics or Latinos | 0.0 /100 | #300 | Tragic 33.3% |
| Immigrants | Somalia | 0.0 /100 | #301 | Tragic 33.4% |
| Arapaho | 0.0 /100 | #302 | Tragic 33.4% |
| Americans | 0.0 /100 | #303 | Tragic 33.5% |
| Mexicans | 0.0 /100 | #304 | Tragic 33.6% |
| Immigrants | Central America | 0.0 /100 | #305 | Tragic 33.6% |
| Immigrants | Congo | 0.0 /100 | #306 | Tragic 33.8% |
| Comanche | 0.0 /100 | #307 | Tragic 33.9% |
| Immigrants | Mexico | 0.0 /100 | #308 | Tragic 34.0% |
Demographics Similar to Japanese by Single Mother Poverty
In terms of single mother poverty, the demographic groups most similar to Japanese are Czech (28.9%, a difference of 0.020%), Immigrants from Cambodia (28.9%, a difference of 0.080%), Scandinavian (28.9%, a difference of 0.10%), Immigrants from Nigeria (28.9%, a difference of 0.11%), and Immigrants from Kenya (28.9%, a difference of 0.11%).
| Demographics | Rating | Rank | Single Mother Poverty |
| Slovenes | 76.4 /100 | #153 | Good 28.8% |
| Portuguese | 73.2 /100 | #154 | Good 28.8% |
| Ugandans | 71.7 /100 | #155 | Good 28.8% |
| Iraqis | 71.5 /100 | #156 | Good 28.8% |
| Immigrants | Western Europe | 71.1 /100 | #157 | Good 28.9% |
| Immigrants | Hungary | 70.6 /100 | #158 | Good 28.9% |
| Czechs | 68.4 /100 | #159 | Good 28.9% |
| Japanese | 68.0 /100 | #160 | Good 28.9% |
| Immigrants | Cambodia | 66.6 /100 | #161 | Good 28.9% |
| Scandinavians | 66.2 /100 | #162 | Good 28.9% |
| Immigrants | Nigeria | 65.9 /100 | #163 | Good 28.9% |
| Immigrants | Kenya | 65.9 /100 | #164 | Good 28.9% |
| Arabs | 60.7 /100 | #165 | Good 29.0% |
| Inupiat | 60.4 /100 | #166 | Good 29.0% |
| Costa Ricans | 58.4 /100 | #167 | Average 29.0% |