Immigrants from Somalia vs Venezuelan Child Poverty Under the Age of 5
COMPARE
Immigrants from Somalia
Venezuelan
Child Poverty Under the Age of 5
Child Poverty Under the Age of 5 Comparison
Immigrants from Somalia
Venezuelans
21.6%
CHILD POVERTY UNDER THE AGE OF 5
0.0/ 100
METRIC RATING
292nd/ 347
METRIC RANK
16.8%
CHILD POVERTY UNDER THE AGE OF 5
73.7/ 100
METRIC RATING
157th/ 347
METRIC RANK
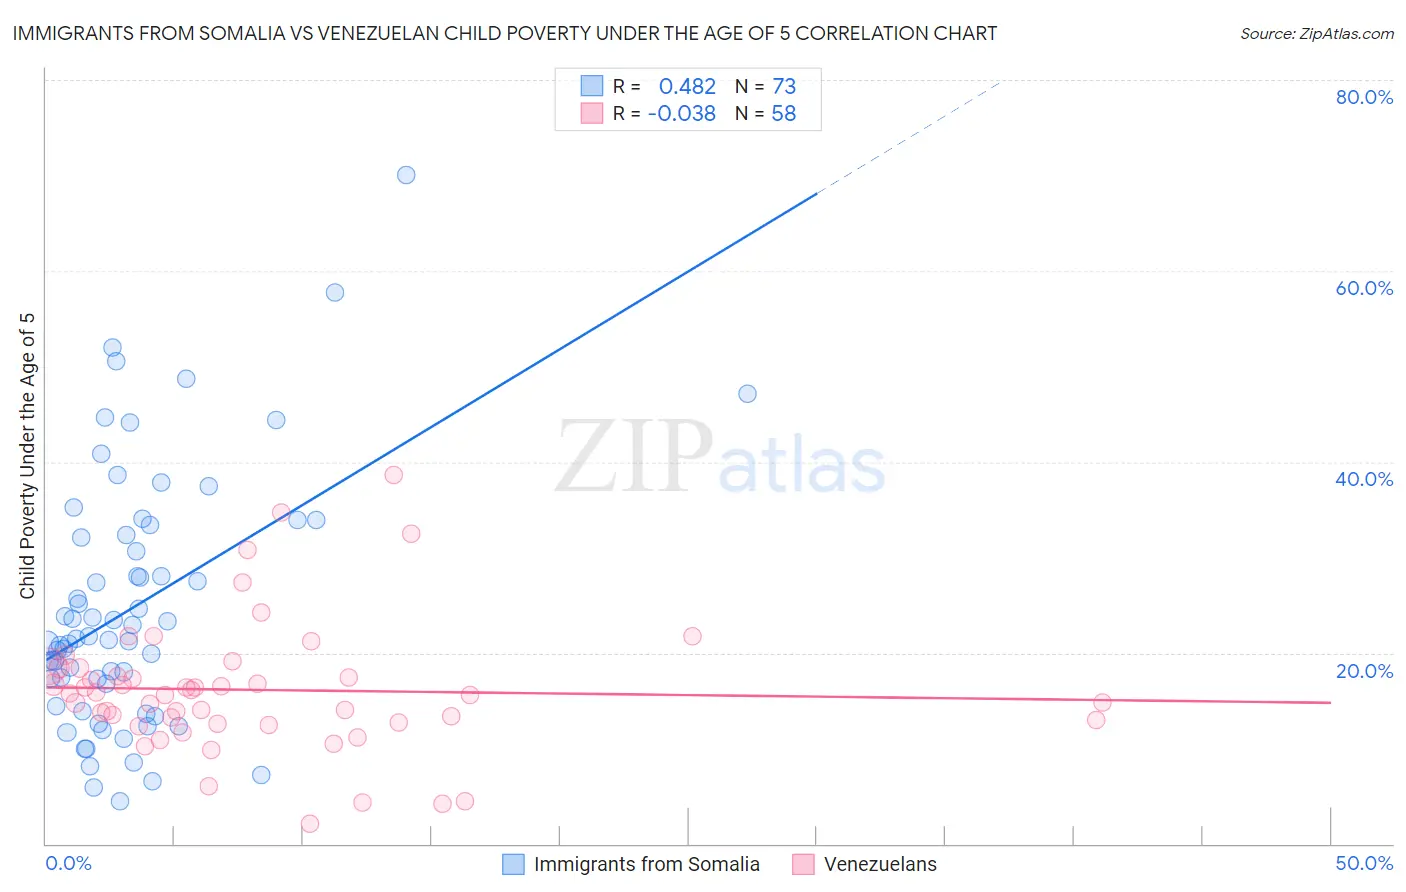
Immigrants from Somalia vs Venezuelan Child Poverty Under the Age of 5 Correlation Chart
The statistical analysis conducted on geographies consisting of 91,565,484 people shows a moderate positive correlation between the proportion of Immigrants from Somalia and poverty level among children under the age of 5 in the United States with a correlation coefficient (R) of 0.482 and weighted average of 21.6%. Similarly, the statistical analysis conducted on geographies consisting of 297,331,987 people shows no correlation between the proportion of Venezuelans and poverty level among children under the age of 5 in the United States with a correlation coefficient (R) of -0.038 and weighted average of 16.8%, a difference of 28.5%.
Child Poverty Under the Age of 5 Correlation Summary
| Measurement | Immigrants from Somalia | Venezuelan |
| Minimum | 4.5% | 2.1% |
| Maximum | 70.0% | 38.7% |
| Range | 65.5% | 36.6% |
| Mean | 24.8% | 16.1% |
| Median | 21.5% | 15.7% |
| Interquartile 25% (IQ1) | 15.6% | 12.7% |
| Interquartile 75% (IQ3) | 32.8% | 18.4% |
| Interquartile Range (IQR) | 17.2% | 5.7% |
| Standard Deviation (Sample) | 13.3% | 6.9% |
| Standard Deviation (Population) | 13.2% | 6.8% |
Similar Demographics by Child Poverty Under the Age of 5
Demographics Similar to Immigrants from Somalia by Child Poverty Under the Age of 5
In terms of child poverty under the age of 5, the demographic groups most similar to Immigrants from Somalia are Mexican (21.6%, a difference of 0.28%), Guatemalan (21.6%, a difference of 0.42%), British West Indian (21.4%, a difference of 0.60%), Cherokee (21.7%, a difference of 0.68%), and Immigrants from Caribbean (21.4%, a difference of 0.77%).
| Demographics | Rating | Rank | Child Poverty Under the Age of 5 |
| Haitians | 0.0 /100 | #285 | Tragic 21.2% |
| Immigrants | Latin America | 0.0 /100 | #286 | Tragic 21.2% |
| Immigrants | Zaire | 0.0 /100 | #287 | Tragic 21.3% |
| Immigrants | Senegal | 0.0 /100 | #288 | Tragic 21.3% |
| Immigrants | Haiti | 0.0 /100 | #289 | Tragic 21.3% |
| Immigrants | Caribbean | 0.0 /100 | #290 | Tragic 21.4% |
| British West Indians | 0.0 /100 | #291 | Tragic 21.4% |
| Immigrants | Somalia | 0.0 /100 | #292 | Tragic 21.6% |
| Mexicans | 0.0 /100 | #293 | Tragic 21.6% |
| Guatemalans | 0.0 /100 | #294 | Tragic 21.6% |
| Cherokee | 0.0 /100 | #295 | Tragic 21.7% |
| Yaqui | 0.0 /100 | #296 | Tragic 21.7% |
| Hispanics or Latinos | 0.0 /100 | #297 | Tragic 21.7% |
| Blackfeet | 0.0 /100 | #298 | Tragic 21.8% |
| Chickasaw | 0.0 /100 | #299 | Tragic 21.8% |
Demographics Similar to Venezuelans by Child Poverty Under the Age of 5
In terms of child poverty under the age of 5, the demographic groups most similar to Venezuelans are Afghan (16.8%, a difference of 0.090%), Czechoslovakian (16.8%, a difference of 0.16%), South American (16.7%, a difference of 0.19%), Immigrants from Syria (16.8%, a difference of 0.20%), and Irish (16.8%, a difference of 0.23%).
| Demographics | Rating | Rank | Child Poverty Under the Age of 5 |
| Colombians | 77.8 /100 | #150 | Good 16.7% |
| Canadians | 77.6 /100 | #151 | Good 16.7% |
| Belgians | 77.2 /100 | #152 | Good 16.7% |
| Dutch | 77.1 /100 | #153 | Good 16.7% |
| Immigrants | Venezuela | 76.0 /100 | #154 | Good 16.7% |
| South Americans | 75.1 /100 | #155 | Good 16.7% |
| Afghans | 74.4 /100 | #156 | Good 16.8% |
| Venezuelans | 73.7 /100 | #157 | Good 16.8% |
| Czechoslovakians | 72.5 /100 | #158 | Good 16.8% |
| Immigrants | Syria | 72.3 /100 | #159 | Good 16.8% |
| Irish | 72.0 /100 | #160 | Good 16.8% |
| English | 70.4 /100 | #161 | Good 16.8% |
| Costa Ricans | 69.8 /100 | #162 | Good 16.9% |
| Scottish | 68.6 /100 | #163 | Good 16.9% |
| Immigrants | Oceania | 67.6 /100 | #164 | Good 16.9% |