Immigrants from Singapore vs Slovak Single Female Poverty
COMPARE
Immigrants from Singapore
Slovak
Single Female Poverty
Single Female Poverty Comparison
Immigrants from Singapore
Slovaks
18.3%
SINGLE FEMALE POVERTY
100.0/ 100
METRIC RATING
25th/ 347
METRIC RANK
21.1%
SINGLE FEMALE POVERTY
39.7/ 100
METRIC RATING
183rd/ 347
METRIC RANK
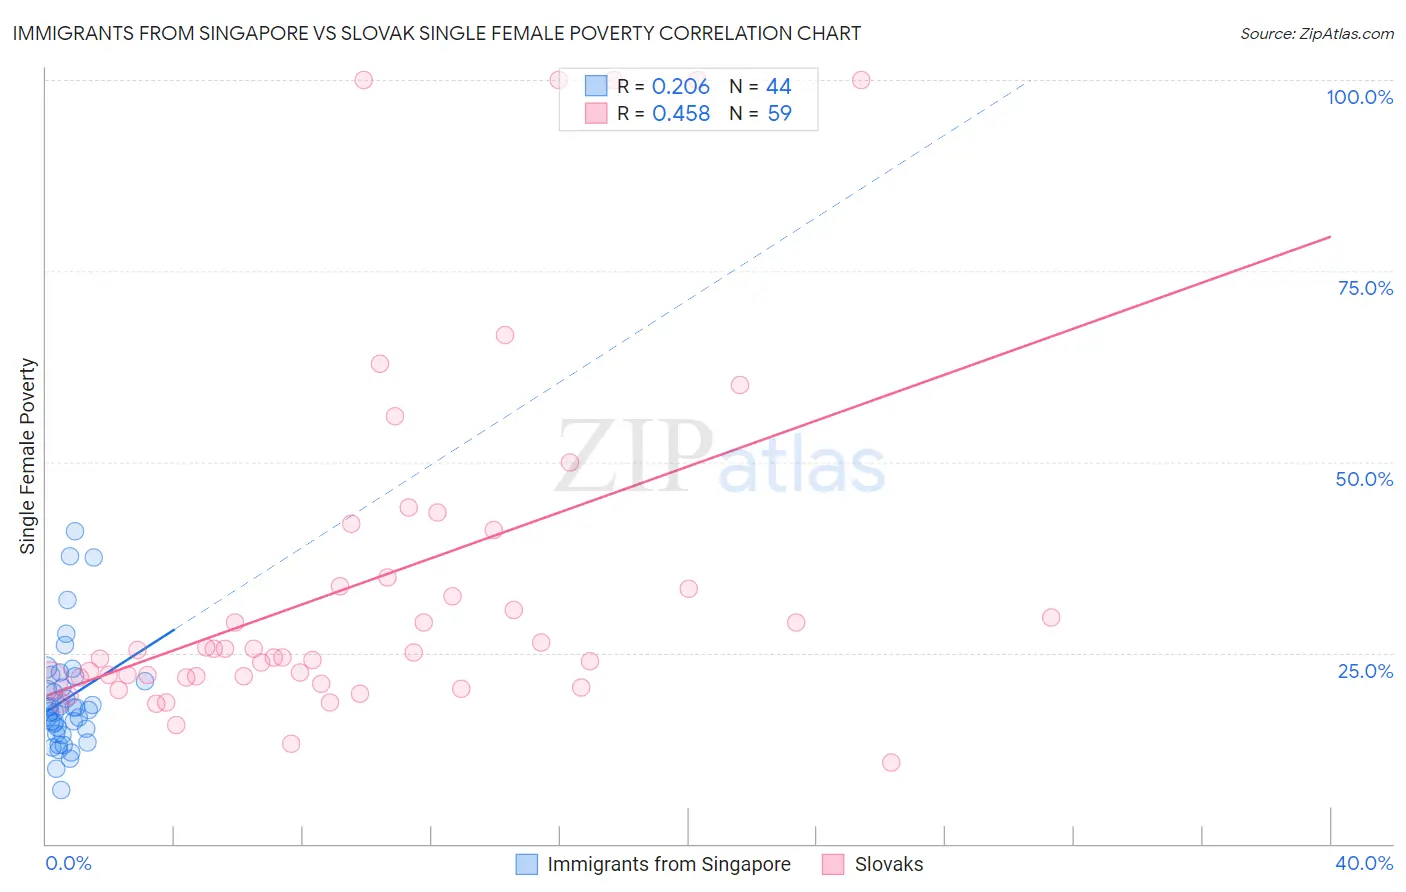
Immigrants from Singapore vs Slovak Single Female Poverty Correlation Chart
The statistical analysis conducted on geographies consisting of 136,295,396 people shows a weak positive correlation between the proportion of Immigrants from Singapore and poverty level among single females in the United States with a correlation coefficient (R) of 0.206 and weighted average of 18.3%. Similarly, the statistical analysis conducted on geographies consisting of 389,214,843 people shows a moderate positive correlation between the proportion of Slovaks and poverty level among single females in the United States with a correlation coefficient (R) of 0.458 and weighted average of 21.1%, a difference of 15.3%.
Single Female Poverty Correlation Summary
| Measurement | Immigrants from Singapore | Slovak |
| Minimum | 7.1% | 10.7% |
| Maximum | 41.0% | 100.0% |
| Range | 33.9% | 89.3% |
| Mean | 19.0% | 34.3% |
| Median | 17.7% | 25.1% |
| Interquartile 25% (IQ1) | 14.8% | 21.8% |
| Interquartile 75% (IQ3) | 21.6% | 34.8% |
| Interquartile Range (IQR) | 6.8% | 13.0% |
| Standard Deviation (Sample) | 7.2% | 23.3% |
| Standard Deviation (Population) | 7.1% | 23.1% |
Similar Demographics by Single Female Poverty
Demographics Similar to Immigrants from Singapore by Single Female Poverty
In terms of single female poverty, the demographic groups most similar to Immigrants from Singapore are Immigrants from Israel (18.3%, a difference of 0.020%), Armenian (18.3%, a difference of 0.10%), Burmese (18.3%, a difference of 0.33%), Asian (18.3%, a difference of 0.33%), and Maltese (18.3%, a difference of 0.34%).
| Demographics | Rating | Rank | Single Female Poverty |
| Immigrants | Eastern Asia | 100.0 /100 | #18 | Exceptional 18.1% |
| Immigrants | China | 100.0 /100 | #19 | Exceptional 18.1% |
| Immigrants | Greece | 100.0 /100 | #20 | Exceptional 18.3% |
| Maltese | 100.0 /100 | #21 | Exceptional 18.3% |
| Burmese | 100.0 /100 | #22 | Exceptional 18.3% |
| Asians | 100.0 /100 | #23 | Exceptional 18.3% |
| Armenians | 100.0 /100 | #24 | Exceptional 18.3% |
| Immigrants | Singapore | 100.0 /100 | #25 | Exceptional 18.3% |
| Immigrants | Israel | 100.0 /100 | #26 | Exceptional 18.3% |
| Immigrants | Pakistan | 100.0 /100 | #27 | Exceptional 18.4% |
| Immigrants | Moldova | 100.0 /100 | #28 | Exceptional 18.5% |
| Immigrants | Poland | 100.0 /100 | #29 | Exceptional 18.5% |
| Immigrants | North Macedonia | 99.9 /100 | #30 | Exceptional 18.5% |
| Immigrants | Asia | 99.9 /100 | #31 | Exceptional 18.6% |
| Immigrants | Sri Lanka | 99.9 /100 | #32 | Exceptional 18.6% |
Demographics Similar to Slovaks by Single Female Poverty
In terms of single female poverty, the demographic groups most similar to Slovaks are Hungarian (21.1%, a difference of 0.010%), Slavic (21.1%, a difference of 0.050%), Immigrants from Cambodia (21.2%, a difference of 0.10%), Hawaiian (21.2%, a difference of 0.14%), and Spanish American Indian (21.1%, a difference of 0.17%).
| Demographics | Rating | Rank | Single Female Poverty |
| Canadians | 45.4 /100 | #176 | Average 21.1% |
| Scandinavians | 45.2 /100 | #177 | Average 21.1% |
| Immigrants | Bosnia and Herzegovina | 44.9 /100 | #178 | Average 21.1% |
| British | 42.9 /100 | #179 | Average 21.1% |
| Spanish American Indians | 42.5 /100 | #180 | Average 21.1% |
| Europeans | 42.3 /100 | #181 | Average 21.1% |
| Slavs | 40.5 /100 | #182 | Average 21.1% |
| Slovaks | 39.7 /100 | #183 | Fair 21.1% |
| Hungarians | 39.6 /100 | #184 | Fair 21.1% |
| Immigrants | Cambodia | 38.2 /100 | #185 | Fair 21.2% |
| Hawaiians | 37.7 /100 | #186 | Fair 21.2% |
| Immigrants | Nigeria | 36.8 /100 | #187 | Fair 21.2% |
| Yugoslavians | 35.4 /100 | #188 | Fair 21.2% |
| Immigrants | Cuba | 35.3 /100 | #189 | Fair 21.2% |
| Trinidadians and Tobagonians | 35.2 /100 | #190 | Fair 21.2% |