Immigrants from Sierra Leone vs Japanese Divorced or Separated
COMPARE
Immigrants from Sierra Leone
Japanese
Divorced or Separated
Divorced or Separated Comparison
Immigrants from Sierra Leone
Japanese
12.1%
DIVORCED OR SEPARATED
50.0/ 100
METRIC RATING
175th/ 347
METRIC RANK
12.0%
DIVORCED OR SEPARATED
70.9/ 100
METRIC RATING
155th/ 347
METRIC RANK
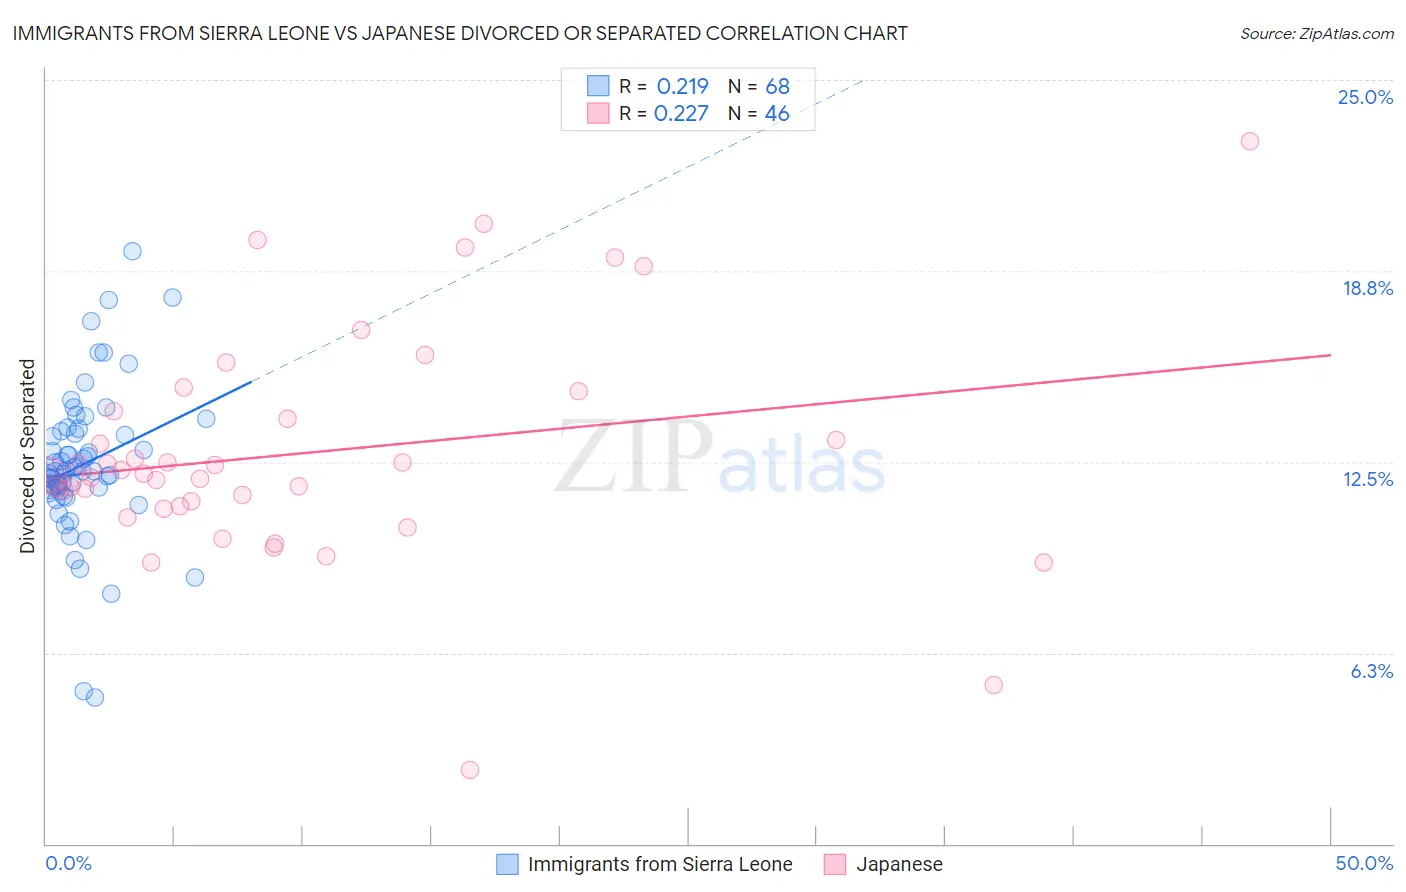
Immigrants from Sierra Leone vs Japanese Divorced or Separated Correlation Chart
The statistical analysis conducted on geographies consisting of 101,651,089 people shows a weak positive correlation between the proportion of Immigrants from Sierra Leone and percentage of population currently divorced or separated in the United States with a correlation coefficient (R) of 0.219 and weighted average of 12.1%. Similarly, the statistical analysis conducted on geographies consisting of 249,125,963 people shows a weak positive correlation between the proportion of Japanese and percentage of population currently divorced or separated in the United States with a correlation coefficient (R) of 0.227 and weighted average of 12.0%, a difference of 0.78%.
Divorced or Separated Correlation Summary
| Measurement | Immigrants from Sierra Leone | Japanese |
| Minimum | 4.8% | 2.4% |
| Maximum | 19.4% | 23.0% |
| Range | 14.6% | 20.6% |
| Mean | 12.4% | 12.8% |
| Median | 12.2% | 12.1% |
| Interquartile 25% (IQ1) | 11.6% | 11.1% |
| Interquartile 75% (IQ3) | 13.5% | 14.1% |
| Interquartile Range (IQR) | 1.9% | 3.1% |
| Standard Deviation (Sample) | 2.4% | 3.8% |
| Standard Deviation (Population) | 2.4% | 3.7% |
Demographics Similar to Immigrants from Sierra Leone and Japanese by Divorced or Separated
In terms of divorced or separated, the demographic groups most similar to Immigrants from Sierra Leone are Hawaiian (12.1%, a difference of 0.0%), Immigrants from Moldova (12.1%, a difference of 0.020%), Immigrants from Mexico (12.0%, a difference of 0.11%), Costa Rican (12.0%, a difference of 0.12%), and Mexican American Indian (12.0%, a difference of 0.20%). Similarly, the demographic groups most similar to Japanese are Hungarian (12.0%, a difference of 0.020%), Immigrants from Brazil (12.0%, a difference of 0.090%), Icelander (12.0%, a difference of 0.19%), Immigrants from Barbados (12.0%, a difference of 0.20%), and Immigrants from Scotland (12.0%, a difference of 0.21%).
| Demographics | Rating | Rank | Divorced or Separated |
| Japanese | 70.9 /100 | #155 | Good 12.0% |
| Hungarians | 70.3 /100 | #156 | Good 12.0% |
| Immigrants | Brazil | 68.8 /100 | #157 | Good 12.0% |
| Icelanders | 66.0 /100 | #158 | Good 12.0% |
| Immigrants | Barbados | 66.0 /100 | #159 | Good 12.0% |
| Immigrants | Scotland | 65.8 /100 | #160 | Good 12.0% |
| Marshallese | 64.6 /100 | #161 | Good 12.0% |
| Samoans | 64.3 /100 | #162 | Good 12.0% |
| Navajo | 63.9 /100 | #163 | Good 12.0% |
| Swiss | 63.6 /100 | #164 | Good 12.0% |
| German Russians | 61.8 /100 | #165 | Good 12.0% |
| Tohono O'odham | 60.4 /100 | #166 | Good 12.0% |
| Ethiopians | 58.5 /100 | #167 | Average 12.0% |
| Serbians | 57.1 /100 | #168 | Average 12.0% |
| Immigrants | Peru | 57.0 /100 | #169 | Average 12.0% |
| Mexican American Indians | 55.8 /100 | #170 | Average 12.0% |
| Costa Ricans | 53.3 /100 | #171 | Average 12.0% |
| Immigrants | Mexico | 53.2 /100 | #172 | Average 12.0% |
| Immigrants | Moldova | 50.4 /100 | #173 | Average 12.1% |
| Hawaiians | 50.0 /100 | #174 | Average 12.1% |
| Immigrants | Sierra Leone | 50.0 /100 | #175 | Average 12.1% |