Immigrants from Sierra Leone vs Japanese Householder Income Under 25 years
COMPARE
Immigrants from Sierra Leone
Japanese
Householder Income Under 25 years
Householder Income Under 25 years Comparison
Immigrants from Sierra Leone
Japanese
$54,190
HOUSEHOLDER INCOME UNDER 25 YEARS
99.3/ 100
METRIC RATING
94th/ 347
METRIC RANK
$52,365
HOUSEHOLDER INCOME UNDER 25 YEARS
60.5/ 100
METRIC RATING
168th/ 347
METRIC RANK
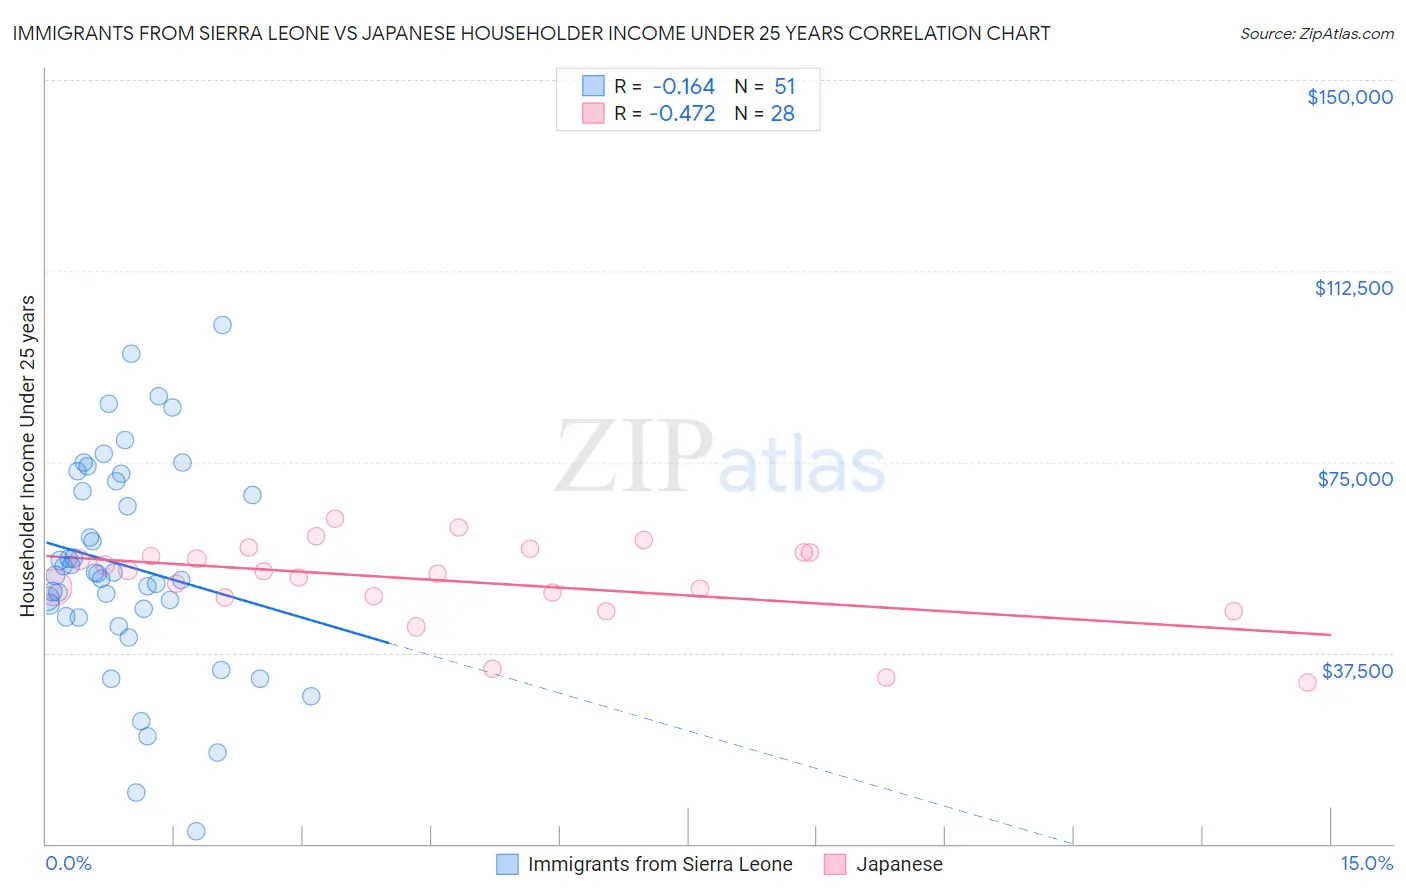
Immigrants from Sierra Leone vs Japanese Householder Income Under 25 years Correlation Chart
The statistical analysis conducted on geographies consisting of 94,629,057 people shows a poor negative correlation between the proportion of Immigrants from Sierra Leone and household income with householder under the age of 25 in the United States with a correlation coefficient (R) of -0.164 and weighted average of $54,190. Similarly, the statistical analysis conducted on geographies consisting of 222,746,712 people shows a moderate negative correlation between the proportion of Japanese and household income with householder under the age of 25 in the United States with a correlation coefficient (R) of -0.472 and weighted average of $52,365, a difference of 3.5%.
Householder Income Under 25 years Correlation Summary
| Measurement | Immigrants from Sierra Leone | Japanese |
| Minimum | $2,499 | $31,569 |
| Maximum | $101,774 | $63,892 |
| Range | $99,275 | $32,323 |
| Mean | $54,632 | $51,521 |
| Median | $53,088 | $53,255 |
| Interquartile 25% (IQ1) | $44,586 | $48,512 |
| Interquartile 75% (IQ3) | $71,123 | $57,313 |
| Interquartile Range (IQR) | $26,537 | $8,801 |
| Standard Deviation (Sample) | $20,949 | $8,318 |
| Standard Deviation (Population) | $20,742 | $8,169 |
Similar Demographics by Householder Income Under 25 years
Demographics Similar to Immigrants from Sierra Leone by Householder Income Under 25 years
In terms of householder income under 25 years, the demographic groups most similar to Immigrants from Sierra Leone are Immigrants from Malaysia ($54,179, a difference of 0.020%), Immigrants from Argentina ($54,209, a difference of 0.030%), Immigrants from St. Vincent and the Grenadines ($54,230, a difference of 0.070%), Argentinean ($54,154, a difference of 0.070%), and Immigrants from Egypt ($54,239, a difference of 0.090%).
| Demographics | Rating | Rank | Householder Income Under 25 years |
| Brazilians | 99.5 /100 | #87 | Exceptional $54,335 |
| Yakama | 99.5 /100 | #88 | Exceptional $54,321 |
| Immigrants | South America | 99.4 /100 | #89 | Exceptional $54,268 |
| Turks | 99.4 /100 | #90 | Exceptional $54,266 |
| Immigrants | Egypt | 99.3 /100 | #91 | Exceptional $54,239 |
| Immigrants | St. Vincent and the Grenadines | 99.3 /100 | #92 | Exceptional $54,230 |
| Immigrants | Argentina | 99.3 /100 | #93 | Exceptional $54,209 |
| Immigrants | Sierra Leone | 99.3 /100 | #94 | Exceptional $54,190 |
| Immigrants | Malaysia | 99.2 /100 | #95 | Exceptional $54,179 |
| Argentineans | 99.2 /100 | #96 | Exceptional $54,154 |
| Immigrants | Portugal | 99.1 /100 | #97 | Exceptional $54,105 |
| Eastern Europeans | 99.0 /100 | #98 | Exceptional $54,066 |
| Alaska Natives | 98.8 /100 | #99 | Exceptional $54,000 |
| Immigrants | Kazakhstan | 98.8 /100 | #100 | Exceptional $53,990 |
| South Americans | 98.6 /100 | #101 | Exceptional $53,939 |
Demographics Similar to Japanese by Householder Income Under 25 years
In terms of householder income under 25 years, the demographic groups most similar to Japanese are Immigrants from Uganda ($52,374, a difference of 0.020%), Canadian ($52,336, a difference of 0.060%), Israeli ($52,335, a difference of 0.060%), Immigrants from Austria ($52,400, a difference of 0.070%), and Polish ($52,407, a difference of 0.080%).
| Demographics | Rating | Rank | Householder Income Under 25 years |
| Uruguayans | 66.2 /100 | #161 | Good $52,465 |
| Immigrants | Cambodia | 65.4 /100 | #162 | Good $52,450 |
| Immigrants | Chile | 64.8 /100 | #163 | Good $52,440 |
| Immigrants | Trinidad and Tobago | 64.7 /100 | #164 | Good $52,437 |
| Poles | 63.0 /100 | #165 | Good $52,407 |
| Immigrants | Austria | 62.6 /100 | #166 | Good $52,400 |
| Immigrants | Uganda | 61.1 /100 | #167 | Good $52,374 |
| Japanese | 60.5 /100 | #168 | Good $52,365 |
| Canadians | 58.8 /100 | #169 | Average $52,336 |
| Israelis | 58.8 /100 | #170 | Average $52,335 |
| Immigrants | Uruguay | 56.8 /100 | #171 | Average $52,302 |
| Cypriots | 51.2 /100 | #172 | Average $52,209 |
| Barbadians | 50.8 /100 | #173 | Average $52,202 |
| Immigrants | Western Asia | 50.0 /100 | #174 | Average $52,190 |
| Immigrants | Zimbabwe | 33.8 /100 | #175 | Fair $51,914 |