Immigrants from Sierra Leone vs Alsatian Child Poverty Under the Age of 16
COMPARE
Immigrants from Sierra Leone
Alsatian
Child Poverty Under the Age of 16
Child Poverty Under the Age of 16 Comparison
Immigrants from Sierra Leone
Alsatians
17.1%
CHILD POVERTY UNDER THE AGE OF 16
14.2/ 100
METRIC RATING
203rd/ 347
METRIC RANK
18.6%
CHILD POVERTY UNDER THE AGE OF 16
0.7/ 100
METRIC RATING
241st/ 347
METRIC RANK
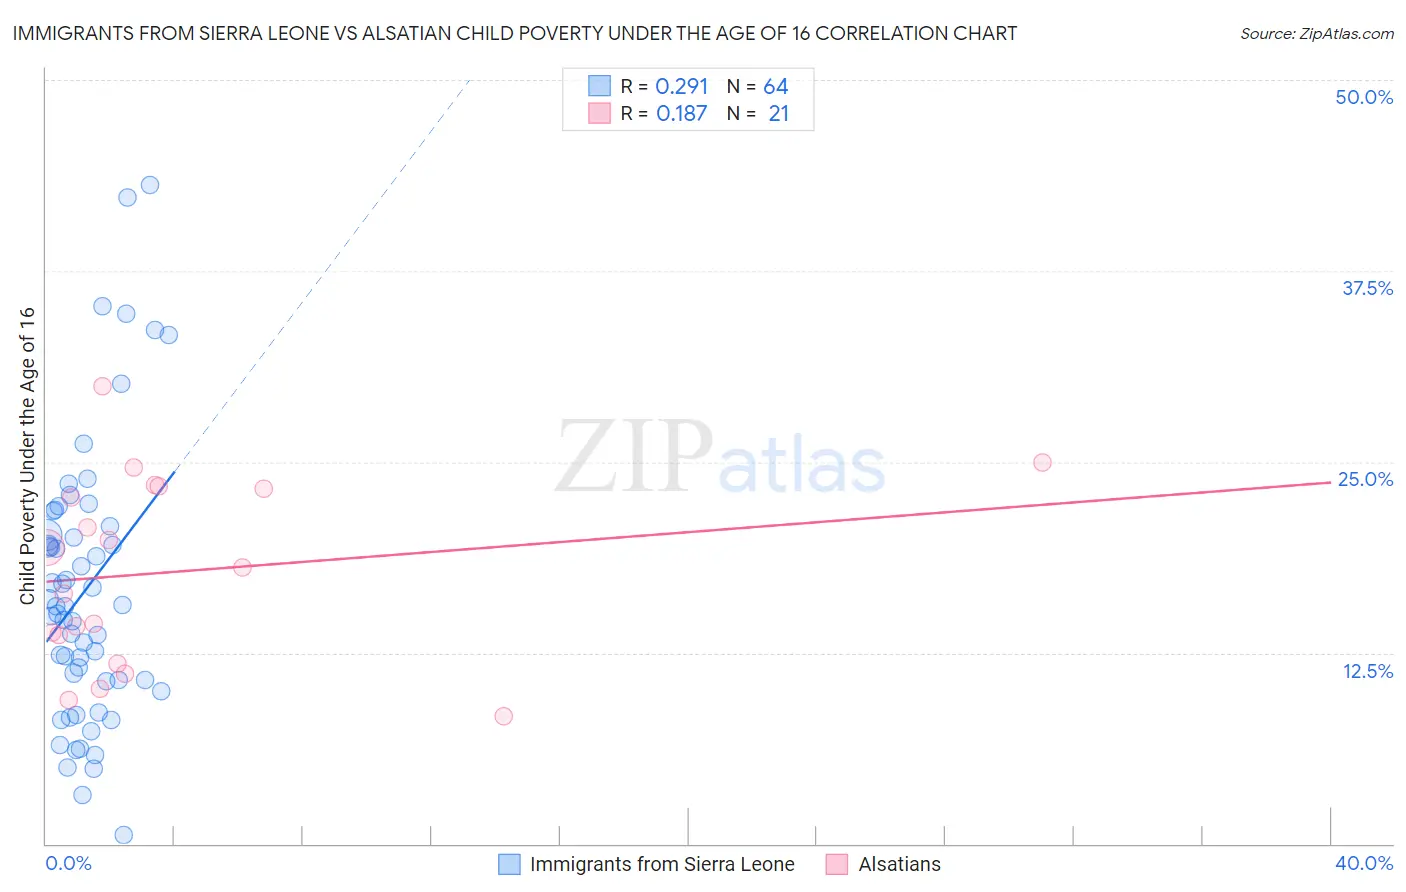
Immigrants from Sierra Leone vs Alsatian Child Poverty Under the Age of 16 Correlation Chart
The statistical analysis conducted on geographies consisting of 101,506,912 people shows a weak positive correlation between the proportion of Immigrants from Sierra Leone and poverty level among children under the age of 16 in the United States with a correlation coefficient (R) of 0.291 and weighted average of 17.1%. Similarly, the statistical analysis conducted on geographies consisting of 82,344,359 people shows a poor positive correlation between the proportion of Alsatians and poverty level among children under the age of 16 in the United States with a correlation coefficient (R) of 0.187 and weighted average of 18.6%, a difference of 9.2%.
Child Poverty Under the Age of 16 Correlation Summary
| Measurement | Immigrants from Sierra Leone | Alsatian |
| Minimum | 0.58% | 8.3% |
| Maximum | 43.1% | 30.0% |
| Range | 42.6% | 21.6% |
| Mean | 16.6% | 17.8% |
| Median | 15.5% | 18.1% |
| Interquartile 25% (IQ1) | 10.7% | 12.8% |
| Interquartile 75% (IQ3) | 20.5% | 23.3% |
| Interquartile Range (IQR) | 9.8% | 10.6% |
| Standard Deviation (Sample) | 9.0% | 6.1% |
| Standard Deviation (Population) | 9.0% | 5.9% |
Similar Demographics by Child Poverty Under the Age of 16
Demographics Similar to Immigrants from Sierra Leone by Child Poverty Under the Age of 16
In terms of child poverty under the age of 16, the demographic groups most similar to Immigrants from Sierra Leone are Ugandan (17.1%, a difference of 0.020%), Hmong (17.1%, a difference of 0.060%), Aleut (17.1%, a difference of 0.070%), Immigrants from Uzbekistan (17.1%, a difference of 0.10%), and Immigrants from Cameroon (17.1%, a difference of 0.11%).
| Demographics | Rating | Rank | Child Poverty Under the Age of 16 |
| Immigrants | Lebanon | 22.0 /100 | #196 | Fair 16.8% |
| Immigrants | Kenya | 19.1 /100 | #197 | Poor 16.9% |
| Delaware | 17.1 /100 | #198 | Poor 17.0% |
| Immigrants | Afghanistan | 15.1 /100 | #199 | Poor 17.0% |
| Immigrants | Cameroon | 14.7 /100 | #200 | Poor 17.1% |
| Immigrants | Uzbekistan | 14.7 /100 | #201 | Poor 17.1% |
| Ugandans | 14.3 /100 | #202 | Poor 17.1% |
| Immigrants | Sierra Leone | 14.2 /100 | #203 | Poor 17.1% |
| Hmong | 14.0 /100 | #204 | Poor 17.1% |
| Aleuts | 13.9 /100 | #205 | Poor 17.1% |
| Alaska Natives | 11.8 /100 | #206 | Poor 17.2% |
| German Russians | 8.6 /100 | #207 | Tragic 17.4% |
| Pennsylvania Germans | 7.5 /100 | #208 | Tragic 17.4% |
| Panamanians | 6.9 /100 | #209 | Tragic 17.5% |
| Alaskan Athabascans | 6.9 /100 | #210 | Tragic 17.5% |
Demographics Similar to Alsatians by Child Poverty Under the Age of 16
In terms of child poverty under the age of 16, the demographic groups most similar to Alsatians are Immigrants from Laos (18.7%, a difference of 0.11%), Immigrants from Cuba (18.7%, a difference of 0.25%), Cape Verdean (18.7%, a difference of 0.32%), Ghanaian (18.6%, a difference of 0.46%), and Immigrants from Sudan (18.5%, a difference of 0.51%).
| Demographics | Rating | Rank | Child Poverty Under the Age of 16 |
| Immigrants | Nigeria | 1.0 /100 | #234 | Tragic 18.4% |
| Nigerians | 1.0 /100 | #235 | Tragic 18.4% |
| Cree | 0.9 /100 | #236 | Tragic 18.5% |
| Sudanese | 0.9 /100 | #237 | Tragic 18.5% |
| Immigrants | Eritrea | 0.8 /100 | #238 | Tragic 18.5% |
| Immigrants | Sudan | 0.8 /100 | #239 | Tragic 18.5% |
| Ghanaians | 0.8 /100 | #240 | Tragic 18.6% |
| Alsatians | 0.7 /100 | #241 | Tragic 18.6% |
| Immigrants | Laos | 0.6 /100 | #242 | Tragic 18.7% |
| Immigrants | Cuba | 0.6 /100 | #243 | Tragic 18.7% |
| Cape Verdeans | 0.6 /100 | #244 | Tragic 18.7% |
| Shoshone | 0.5 /100 | #245 | Tragic 18.8% |
| Immigrants | Nicaragua | 0.4 /100 | #246 | Tragic 18.8% |
| French American Indians | 0.4 /100 | #247 | Tragic 18.9% |
| Ecuadorians | 0.3 /100 | #248 | Tragic 19.0% |