Immigrants from Sierra Leone vs Immigrants from El Salvador Family Poverty
COMPARE
Immigrants from Sierra Leone
Immigrants from El Salvador
Family Poverty
Family Poverty Comparison
Immigrants from Sierra Leone
Immigrants from El Salvador
9.4%
FAMILY POVERTY
19.6/ 100
METRIC RATING
202nd/ 347
METRIC RANK
11.0%
FAMILY POVERTY
0.1/ 100
METRIC RATING
266th/ 347
METRIC RANK
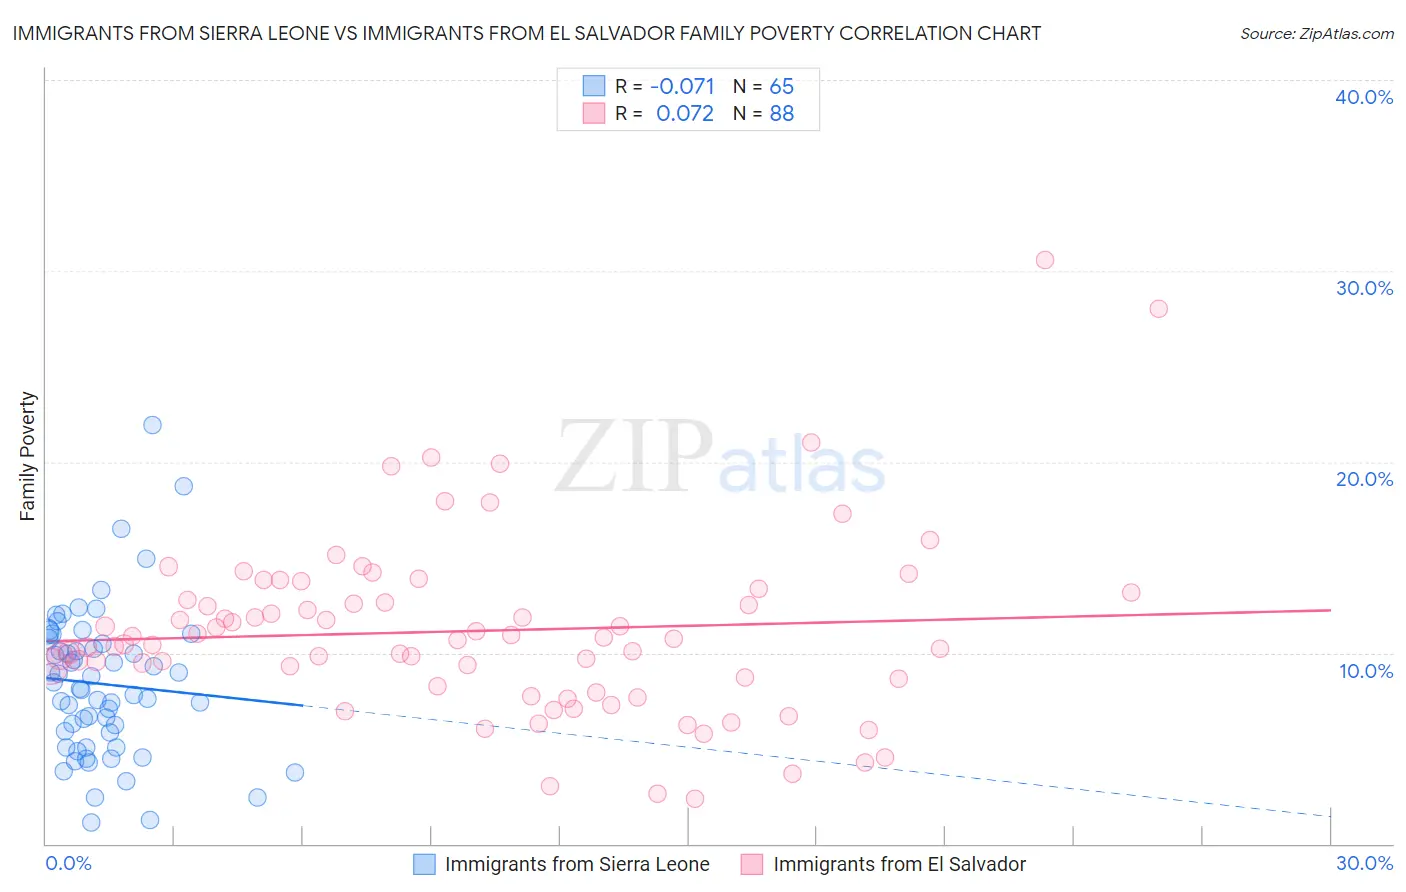
Immigrants from Sierra Leone vs Immigrants from El Salvador Family Poverty Correlation Chart
The statistical analysis conducted on geographies consisting of 101,579,524 people shows a slight negative correlation between the proportion of Immigrants from Sierra Leone and poverty level among families in the United States with a correlation coefficient (R) of -0.071 and weighted average of 9.4%. Similarly, the statistical analysis conducted on geographies consisting of 357,239,196 people shows a slight positive correlation between the proportion of Immigrants from El Salvador and poverty level among families in the United States with a correlation coefficient (R) of 0.072 and weighted average of 11.0%, a difference of 17.3%.
Family Poverty Correlation Summary
| Measurement | Immigrants from Sierra Leone | Immigrants from El Salvador |
| Minimum | 1.1% | 2.4% |
| Maximum | 21.9% | 30.5% |
| Range | 20.8% | 28.2% |
| Mean | 8.4% | 11.1% |
| Median | 8.1% | 10.7% |
| Interquartile 25% (IQ1) | 5.5% | 8.4% |
| Interquartile 75% (IQ3) | 10.6% | 13.0% |
| Interquartile Range (IQR) | 5.1% | 4.5% |
| Standard Deviation (Sample) | 3.9% | 4.8% |
| Standard Deviation (Population) | 3.9% | 4.7% |
Similar Demographics by Family Poverty
Demographics Similar to Immigrants from Sierra Leone by Family Poverty
In terms of family poverty, the demographic groups most similar to Immigrants from Sierra Leone are German Russian (9.4%, a difference of 0.040%), Immigrants from Lebanon (9.4%, a difference of 0.14%), Immigrants from Portugal (9.4%, a difference of 0.17%), Aleut (9.5%, a difference of 0.33%), and Immigrants from South America (9.5%, a difference of 0.34%).
| Demographics | Rating | Rank | Family Poverty |
| Venezuelans | 27.4 /100 | #195 | Fair 9.3% |
| Immigrants | Venezuela | 26.1 /100 | #196 | Fair 9.3% |
| Immigrants | Colombia | 24.4 /100 | #197 | Fair 9.3% |
| Iraqis | 24.2 /100 | #198 | Fair 9.3% |
| Spaniards | 22.8 /100 | #199 | Fair 9.4% |
| Immigrants | Costa Rica | 21.7 /100 | #200 | Fair 9.4% |
| Immigrants | Portugal | 20.5 /100 | #201 | Fair 9.4% |
| Immigrants | Sierra Leone | 19.6 /100 | #202 | Poor 9.4% |
| German Russians | 19.4 /100 | #203 | Poor 9.4% |
| Immigrants | Lebanon | 18.9 /100 | #204 | Poor 9.4% |
| Aleuts | 18.0 /100 | #205 | Poor 9.5% |
| Immigrants | South America | 18.0 /100 | #206 | Poor 9.5% |
| Sierra Leoneans | 15.6 /100 | #207 | Poor 9.5% |
| Immigrants | Eastern Africa | 15.1 /100 | #208 | Poor 9.5% |
| Immigrants | Uruguay | 14.0 /100 | #209 | Poor 9.5% |
Demographics Similar to Immigrants from El Salvador by Family Poverty
In terms of family poverty, the demographic groups most similar to Immigrants from El Salvador are Comanche (11.0%, a difference of 0.010%), Jamaican (11.1%, a difference of 0.12%), Immigrants from Ecuador (11.1%, a difference of 0.60%), Immigrants from Nicaragua (11.1%, a difference of 0.60%), and Immigrants from Bahamas (11.1%, a difference of 0.85%).
| Demographics | Rating | Rank | Family Poverty |
| Mexican American Indians | 0.2 /100 | #259 | Tragic 10.9% |
| Bangladeshis | 0.2 /100 | #260 | Tragic 10.9% |
| Shoshone | 0.2 /100 | #261 | Tragic 10.9% |
| Spanish American Indians | 0.2 /100 | #262 | Tragic 10.9% |
| Cape Verdeans | 0.1 /100 | #263 | Tragic 10.9% |
| Trinidadians and Tobagonians | 0.1 /100 | #264 | Tragic 10.9% |
| Immigrants | Trinidad and Tobago | 0.1 /100 | #265 | Tragic 10.9% |
| Immigrants | El Salvador | 0.1 /100 | #266 | Tragic 11.0% |
| Comanche | 0.1 /100 | #267 | Tragic 11.0% |
| Jamaicans | 0.1 /100 | #268 | Tragic 11.1% |
| Immigrants | Ecuador | 0.1 /100 | #269 | Tragic 11.1% |
| Immigrants | Nicaragua | 0.1 /100 | #270 | Tragic 11.1% |
| Immigrants | Bahamas | 0.1 /100 | #271 | Tragic 11.1% |
| Immigrants | Jamaica | 0.1 /100 | #272 | Tragic 11.2% |
| Somalis | 0.1 /100 | #273 | Tragic 11.2% |