Immigrants from Guatemala vs Immigrants from El Salvador Family Poverty
COMPARE
Immigrants from Guatemala
Immigrants from El Salvador
Family Poverty
Family Poverty Comparison
Immigrants from Guatemala
Immigrants from El Salvador
12.0%
FAMILY POVERTY
0.0/ 100
METRIC RATING
310th/ 347
METRIC RANK
11.0%
FAMILY POVERTY
0.1/ 100
METRIC RATING
266th/ 347
METRIC RANK
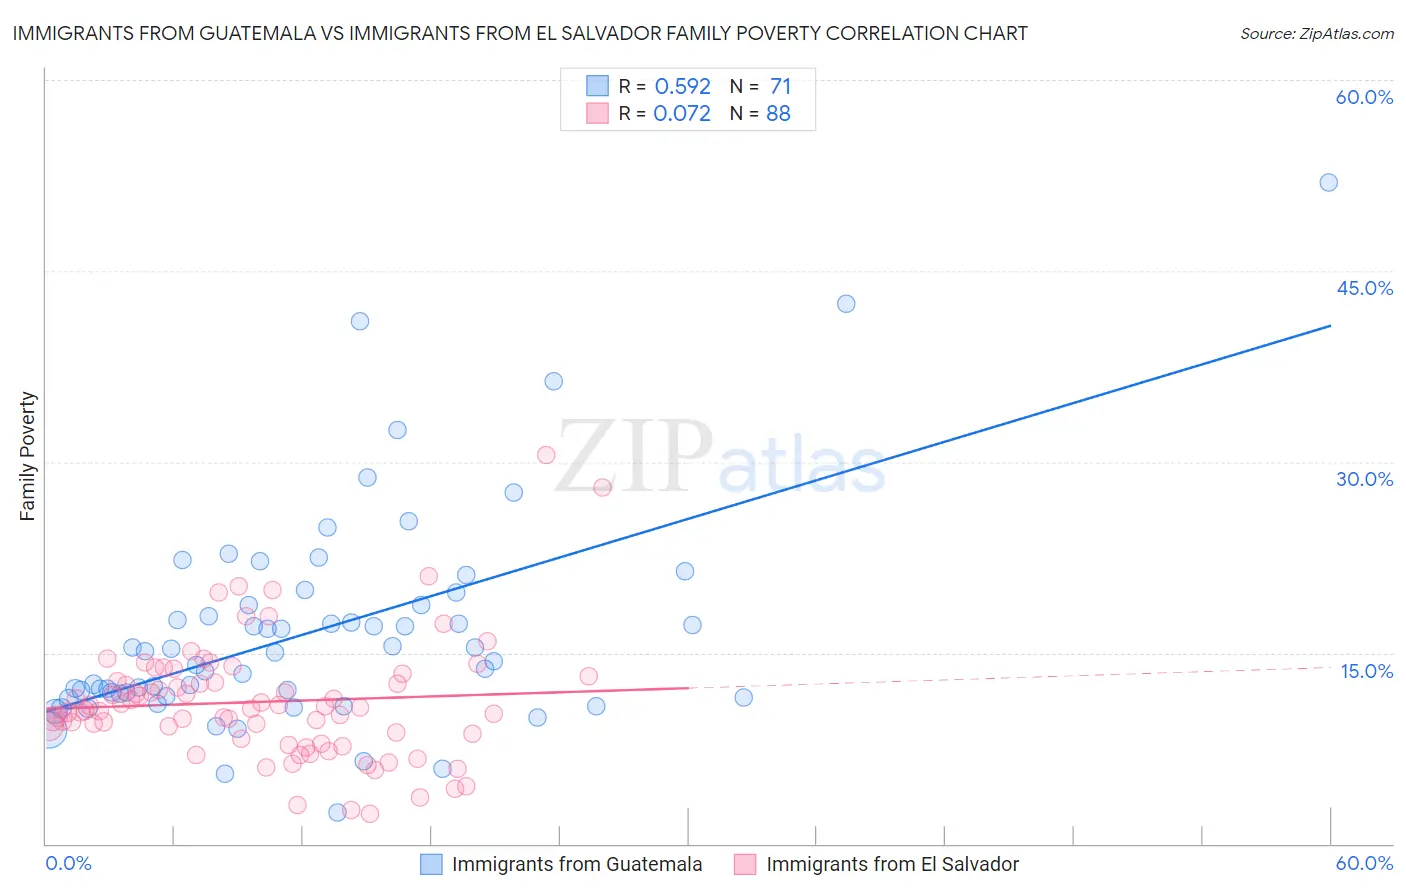
Immigrants from Guatemala vs Immigrants from El Salvador Family Poverty Correlation Chart
The statistical analysis conducted on geographies consisting of 376,740,160 people shows a substantial positive correlation between the proportion of Immigrants from Guatemala and poverty level among families in the United States with a correlation coefficient (R) of 0.592 and weighted average of 12.0%. Similarly, the statistical analysis conducted on geographies consisting of 357,239,196 people shows a slight positive correlation between the proportion of Immigrants from El Salvador and poverty level among families in the United States with a correlation coefficient (R) of 0.072 and weighted average of 11.0%, a difference of 8.2%.
Family Poverty Correlation Summary
| Measurement | Immigrants from Guatemala | Immigrants from El Salvador |
| Minimum | 2.5% | 2.4% |
| Maximum | 51.9% | 30.5% |
| Range | 49.4% | 28.2% |
| Mean | 16.7% | 11.1% |
| Median | 15.1% | 10.7% |
| Interquartile 25% (IQ1) | 11.6% | 8.4% |
| Interquartile 75% (IQ3) | 18.8% | 13.0% |
| Interquartile Range (IQR) | 7.2% | 4.5% |
| Standard Deviation (Sample) | 8.6% | 4.8% |
| Standard Deviation (Population) | 8.5% | 4.7% |
Similar Demographics by Family Poverty
Demographics Similar to Immigrants from Guatemala by Family Poverty
In terms of family poverty, the demographic groups most similar to Immigrants from Guatemala are Hispanic or Latino (12.0%, a difference of 0.0%), Seminole (11.9%, a difference of 0.45%), Immigrants from Congo (11.9%, a difference of 0.51%), Cajun (11.9%, a difference of 0.62%), and Ute (12.1%, a difference of 0.84%).
| Demographics | Rating | Rank | Family Poverty |
| Africans | 0.0 /100 | #303 | Tragic 11.8% |
| Immigrants | Latin America | 0.0 /100 | #304 | Tragic 11.8% |
| Mexicans | 0.0 /100 | #305 | Tragic 11.8% |
| Cajuns | 0.0 /100 | #306 | Tragic 11.9% |
| Immigrants | Congo | 0.0 /100 | #307 | Tragic 11.9% |
| Seminole | 0.0 /100 | #308 | Tragic 11.9% |
| Hispanics or Latinos | 0.0 /100 | #309 | Tragic 12.0% |
| Immigrants | Guatemala | 0.0 /100 | #310 | Tragic 12.0% |
| Ute | 0.0 /100 | #311 | Tragic 12.1% |
| Immigrants | Central America | 0.0 /100 | #312 | Tragic 12.1% |
| Immigrants | Caribbean | 0.0 /100 | #313 | Tragic 12.2% |
| Kiowa | 0.0 /100 | #314 | Tragic 12.2% |
| Immigrants | Mexico | 0.0 /100 | #315 | Tragic 12.3% |
| Hondurans | 0.0 /100 | #316 | Tragic 12.4% |
| Immigrants | Grenada | 0.0 /100 | #317 | Tragic 12.4% |
Demographics Similar to Immigrants from El Salvador by Family Poverty
In terms of family poverty, the demographic groups most similar to Immigrants from El Salvador are Comanche (11.0%, a difference of 0.010%), Jamaican (11.1%, a difference of 0.12%), Immigrants from Ecuador (11.1%, a difference of 0.60%), Immigrants from Nicaragua (11.1%, a difference of 0.60%), and Immigrants from Bahamas (11.1%, a difference of 0.85%).
| Demographics | Rating | Rank | Family Poverty |
| Mexican American Indians | 0.2 /100 | #259 | Tragic 10.9% |
| Bangladeshis | 0.2 /100 | #260 | Tragic 10.9% |
| Shoshone | 0.2 /100 | #261 | Tragic 10.9% |
| Spanish American Indians | 0.2 /100 | #262 | Tragic 10.9% |
| Cape Verdeans | 0.1 /100 | #263 | Tragic 10.9% |
| Trinidadians and Tobagonians | 0.1 /100 | #264 | Tragic 10.9% |
| Immigrants | Trinidad and Tobago | 0.1 /100 | #265 | Tragic 10.9% |
| Immigrants | El Salvador | 0.1 /100 | #266 | Tragic 11.0% |
| Comanche | 0.1 /100 | #267 | Tragic 11.0% |
| Jamaicans | 0.1 /100 | #268 | Tragic 11.1% |
| Immigrants | Ecuador | 0.1 /100 | #269 | Tragic 11.1% |
| Immigrants | Nicaragua | 0.1 /100 | #270 | Tragic 11.1% |
| Immigrants | Bahamas | 0.1 /100 | #271 | Tragic 11.1% |
| Immigrants | Jamaica | 0.1 /100 | #272 | Tragic 11.2% |
| Somalis | 0.1 /100 | #273 | Tragic 11.2% |