Immigrants from Sierra Leone vs Swedish Family Poverty
COMPARE
Immigrants from Sierra Leone
Swedish
Family Poverty
Family Poverty Comparison
Immigrants from Sierra Leone
Swedes
9.4%
FAMILY POVERTY
19.6/ 100
METRIC RATING
202nd/ 347
METRIC RANK
7.1%
FAMILY POVERTY
99.8/ 100
METRIC RATING
13th/ 347
METRIC RANK
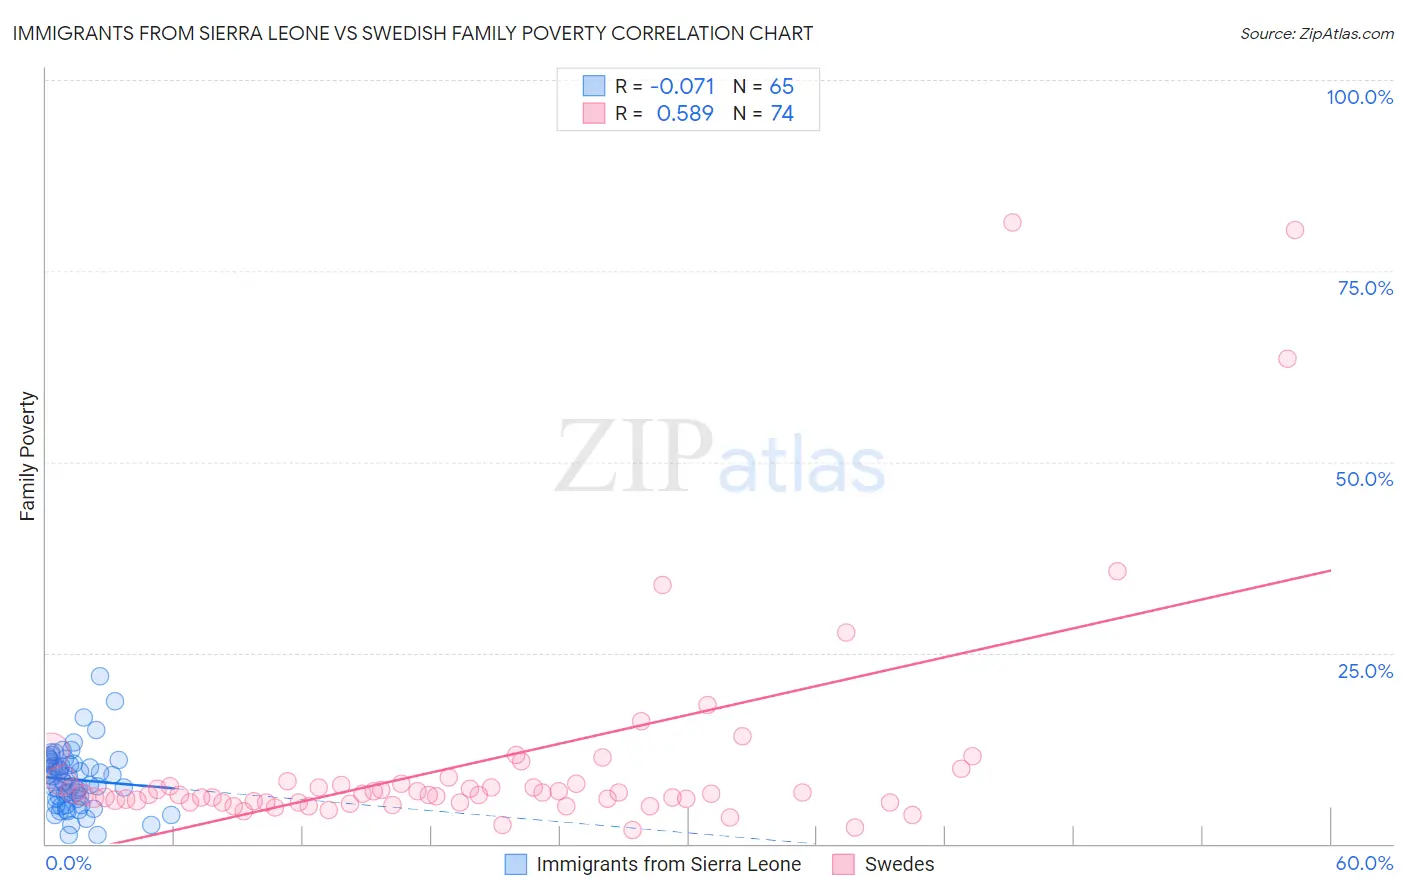
Immigrants from Sierra Leone vs Swedish Family Poverty Correlation Chart
The statistical analysis conducted on geographies consisting of 101,579,524 people shows a slight negative correlation between the proportion of Immigrants from Sierra Leone and poverty level among families in the United States with a correlation coefficient (R) of -0.071 and weighted average of 9.4%. Similarly, the statistical analysis conducted on geographies consisting of 535,382,987 people shows a substantial positive correlation between the proportion of Swedes and poverty level among families in the United States with a correlation coefficient (R) of 0.589 and weighted average of 7.1%, a difference of 32.3%.
Family Poverty Correlation Summary
| Measurement | Immigrants from Sierra Leone | Swedish |
| Minimum | 1.1% | 1.8% |
| Maximum | 21.9% | 81.3% |
| Range | 20.8% | 79.6% |
| Mean | 8.4% | 10.7% |
| Median | 8.1% | 6.5% |
| Interquartile 25% (IQ1) | 5.5% | 5.4% |
| Interquartile 75% (IQ3) | 10.6% | 7.9% |
| Interquartile Range (IQR) | 5.1% | 2.5% |
| Standard Deviation (Sample) | 3.9% | 14.6% |
| Standard Deviation (Population) | 3.9% | 14.5% |
Similar Demographics by Family Poverty
Demographics Similar to Immigrants from Sierra Leone by Family Poverty
In terms of family poverty, the demographic groups most similar to Immigrants from Sierra Leone are German Russian (9.4%, a difference of 0.040%), Immigrants from Lebanon (9.4%, a difference of 0.14%), Immigrants from Portugal (9.4%, a difference of 0.17%), Aleut (9.5%, a difference of 0.33%), and Immigrants from South America (9.5%, a difference of 0.34%).
| Demographics | Rating | Rank | Family Poverty |
| Venezuelans | 27.4 /100 | #195 | Fair 9.3% |
| Immigrants | Venezuela | 26.1 /100 | #196 | Fair 9.3% |
| Immigrants | Colombia | 24.4 /100 | #197 | Fair 9.3% |
| Iraqis | 24.2 /100 | #198 | Fair 9.3% |
| Spaniards | 22.8 /100 | #199 | Fair 9.4% |
| Immigrants | Costa Rica | 21.7 /100 | #200 | Fair 9.4% |
| Immigrants | Portugal | 20.5 /100 | #201 | Fair 9.4% |
| Immigrants | Sierra Leone | 19.6 /100 | #202 | Poor 9.4% |
| German Russians | 19.4 /100 | #203 | Poor 9.4% |
| Immigrants | Lebanon | 18.9 /100 | #204 | Poor 9.4% |
| Aleuts | 18.0 /100 | #205 | Poor 9.5% |
| Immigrants | South America | 18.0 /100 | #206 | Poor 9.5% |
| Sierra Leoneans | 15.6 /100 | #207 | Poor 9.5% |
| Immigrants | Eastern Africa | 15.1 /100 | #208 | Poor 9.5% |
| Immigrants | Uruguay | 14.0 /100 | #209 | Poor 9.5% |
Demographics Similar to Swedes by Family Poverty
In terms of family poverty, the demographic groups most similar to Swedes are Iranian (7.1%, a difference of 0.010%), Maltese (7.1%, a difference of 0.050%), Immigrants from Singapore (7.1%, a difference of 0.34%), Bulgarian (7.1%, a difference of 0.35%), and Latvian (7.1%, a difference of 0.60%).
| Demographics | Rating | Rank | Family Poverty |
| Norwegians | 99.9 /100 | #6 | Exceptional 6.9% |
| Immigrants | Ireland | 99.9 /100 | #7 | Exceptional 7.0% |
| Bhutanese | 99.9 /100 | #8 | Exceptional 7.0% |
| Latvians | 99.9 /100 | #9 | Exceptional 7.1% |
| Bulgarians | 99.8 /100 | #10 | Exceptional 7.1% |
| Immigrants | Singapore | 99.8 /100 | #11 | Exceptional 7.1% |
| Maltese | 99.8 /100 | #12 | Exceptional 7.1% |
| Swedes | 99.8 /100 | #13 | Exceptional 7.1% |
| Iranians | 99.8 /100 | #14 | Exceptional 7.1% |
| Lithuanians | 99.8 /100 | #15 | Exceptional 7.2% |
| Immigrants | South Central Asia | 99.8 /100 | #16 | Exceptional 7.2% |
| Luxembourgers | 99.8 /100 | #17 | Exceptional 7.2% |
| Immigrants | Lithuania | 99.8 /100 | #18 | Exceptional 7.2% |
| Eastern Europeans | 99.7 /100 | #19 | Exceptional 7.2% |
| Immigrants | Hong Kong | 99.7 /100 | #20 | Exceptional 7.3% |