Immigrants from Senegal vs Immigrants from Turkey Female Poverty Among 25-34 Year Olds
COMPARE
Immigrants from Senegal
Immigrants from Turkey
Female Poverty Among 25-34 Year Olds
Female Poverty Among 25-34 Year Olds Comparison
Immigrants from Senegal
Immigrants from Turkey
15.6%
FEMALE POVERTY AMONG 25-34 YEAR OLDS
0.1/ 100
METRIC RATING
268th/ 347
METRIC RANK
11.9%
FEMALE POVERTY AMONG 25-34 YEAR OLDS
99.7/ 100
METRIC RATING
42nd/ 347
METRIC RANK
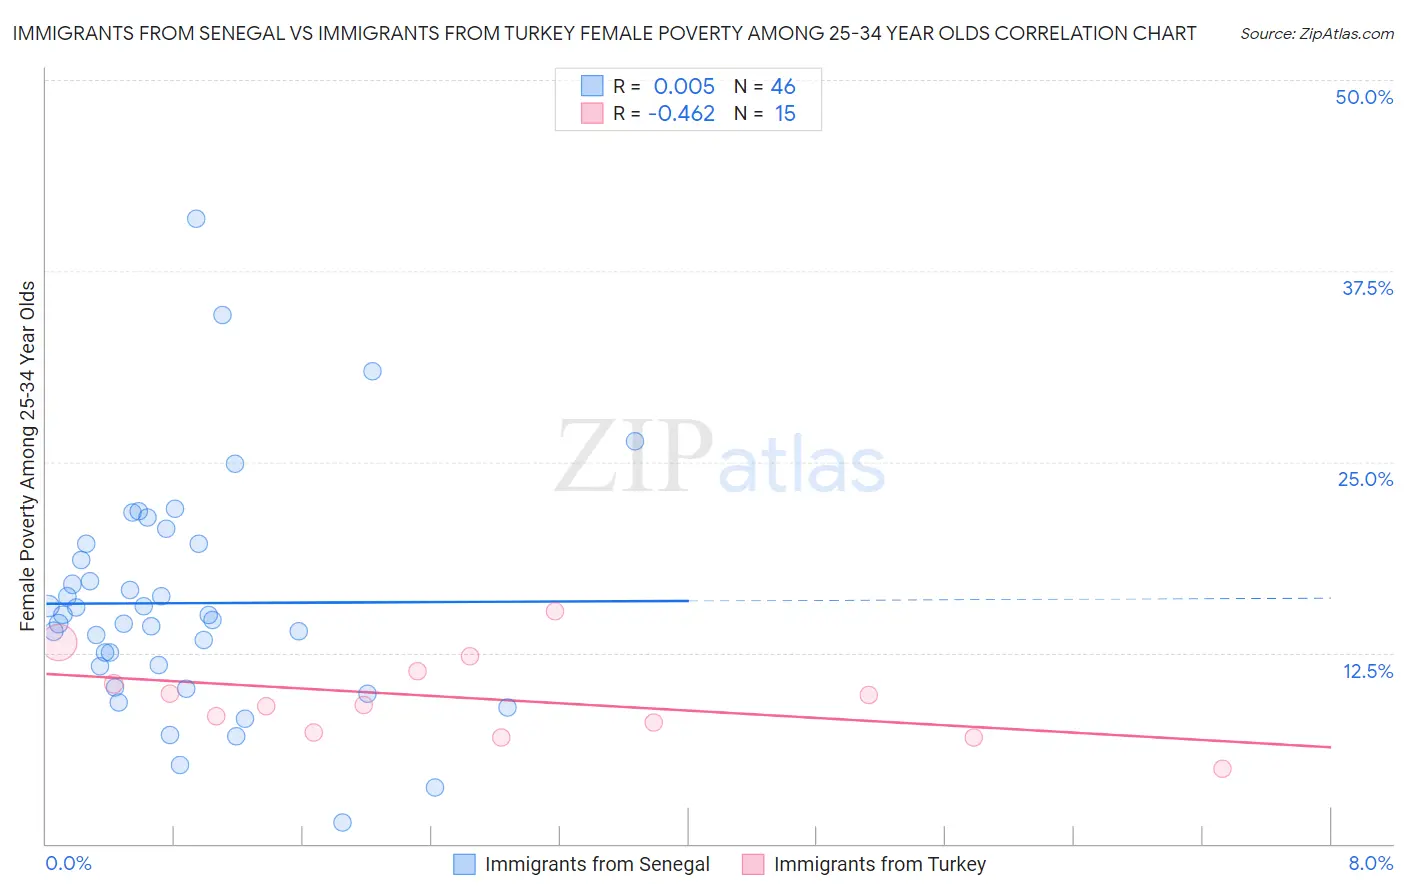
Immigrants from Senegal vs Immigrants from Turkey Female Poverty Among 25-34 Year Olds Correlation Chart
The statistical analysis conducted on geographies consisting of 89,842,598 people shows no correlation between the proportion of Immigrants from Senegal and poverty level among females between the ages 25 and 34 in the United States with a correlation coefficient (R) of 0.005 and weighted average of 15.6%. Similarly, the statistical analysis conducted on geographies consisting of 220,548,075 people shows a moderate negative correlation between the proportion of Immigrants from Turkey and poverty level among females between the ages 25 and 34 in the United States with a correlation coefficient (R) of -0.462 and weighted average of 11.9%, a difference of 30.9%.
Female Poverty Among 25-34 Year Olds Correlation Summary
| Measurement | Immigrants from Senegal | Immigrants from Turkey |
| Minimum | 1.4% | 4.9% |
| Maximum | 40.9% | 15.3% |
| Range | 39.5% | 10.3% |
| Mean | 15.8% | 9.5% |
| Median | 14.8% | 9.1% |
| Interquartile 25% (IQ1) | 11.6% | 7.3% |
| Interquartile 75% (IQ3) | 19.6% | 11.3% |
| Interquartile Range (IQR) | 8.0% | 4.0% |
| Standard Deviation (Sample) | 7.5% | 2.7% |
| Standard Deviation (Population) | 7.5% | 2.6% |
Similar Demographics by Female Poverty Among 25-34 Year Olds
Demographics Similar to Immigrants from Senegal by Female Poverty Among 25-34 Year Olds
In terms of female poverty among 25-34 year olds, the demographic groups most similar to Immigrants from Senegal are Subsaharan African (15.6%, a difference of 0.21%), British West Indian (15.6%, a difference of 0.36%), Cree (15.6%, a difference of 0.37%), Central American (15.5%, a difference of 0.42%), and Senegalese (15.6%, a difference of 0.44%).
| Demographics | Rating | Rank | Female Poverty Among 25-34 Year Olds |
| Liberians | 0.2 /100 | #261 | Tragic 15.3% |
| Immigrants | Belize | 0.2 /100 | #262 | Tragic 15.3% |
| Mexican American Indians | 0.2 /100 | #263 | Tragic 15.4% |
| Pennsylvania Germans | 0.1 /100 | #264 | Tragic 15.4% |
| Immigrants | Liberia | 0.1 /100 | #265 | Tragic 15.4% |
| Immigrants | Somalia | 0.1 /100 | #266 | Tragic 15.4% |
| Central Americans | 0.1 /100 | #267 | Tragic 15.5% |
| Immigrants | Senegal | 0.1 /100 | #268 | Tragic 15.6% |
| Sub-Saharan Africans | 0.1 /100 | #269 | Tragic 15.6% |
| British West Indians | 0.1 /100 | #270 | Tragic 15.6% |
| Cree | 0.1 /100 | #271 | Tragic 15.6% |
| Senegalese | 0.1 /100 | #272 | Tragic 15.6% |
| Immigrants | Nonimmigrants | 0.1 /100 | #273 | Tragic 15.6% |
| Immigrants | Caribbean | 0.0 /100 | #274 | Tragic 15.7% |
| Immigrants | Azores | 0.0 /100 | #275 | Tragic 15.8% |
Demographics Similar to Immigrants from Turkey by Female Poverty Among 25-34 Year Olds
In terms of female poverty among 25-34 year olds, the demographic groups most similar to Immigrants from Turkey are Egyptian (11.9%, a difference of 0.25%), Immigrants from Australia (11.9%, a difference of 0.26%), Immigrants from Indonesia (11.8%, a difference of 0.30%), Immigrants from Bulgaria (11.8%, a difference of 0.42%), and Macedonian (11.9%, a difference of 0.53%).
| Demographics | Rating | Rank | Female Poverty Among 25-34 Year Olds |
| Cambodians | 99.9 /100 | #35 | Exceptional 11.7% |
| Immigrants | Sri Lanka | 99.8 /100 | #36 | Exceptional 11.8% |
| Taiwanese | 99.8 /100 | #37 | Exceptional 11.8% |
| Immigrants | North Macedonia | 99.8 /100 | #38 | Exceptional 11.8% |
| Latvians | 99.8 /100 | #39 | Exceptional 11.8% |
| Immigrants | Bulgaria | 99.8 /100 | #40 | Exceptional 11.8% |
| Immigrants | Indonesia | 99.8 /100 | #41 | Exceptional 11.8% |
| Immigrants | Turkey | 99.7 /100 | #42 | Exceptional 11.9% |
| Egyptians | 99.7 /100 | #43 | Exceptional 11.9% |
| Immigrants | Australia | 99.7 /100 | #44 | Exceptional 11.9% |
| Macedonians | 99.7 /100 | #45 | Exceptional 11.9% |
| Immigrants | Serbia | 99.7 /100 | #46 | Exceptional 11.9% |
| Koreans | 99.6 /100 | #47 | Exceptional 12.0% |
| Immigrants | Belarus | 99.6 /100 | #48 | Exceptional 12.0% |
| Immigrants | Egypt | 99.6 /100 | #49 | Exceptional 12.0% |