Immigrants from Senegal vs Immigrants from Turkey Professional Degree
COMPARE
Immigrants from Senegal
Immigrants from Turkey
Professional Degree
Professional Degree Comparison
Immigrants from Senegal
Immigrants from Turkey
4.5%
PROFESSIONAL DEGREE
68.0/ 100
METRIC RATING
160th/ 347
METRIC RANK
6.2%
PROFESSIONAL DEGREE
100.0/ 100
METRIC RATING
30th/ 347
METRIC RANK
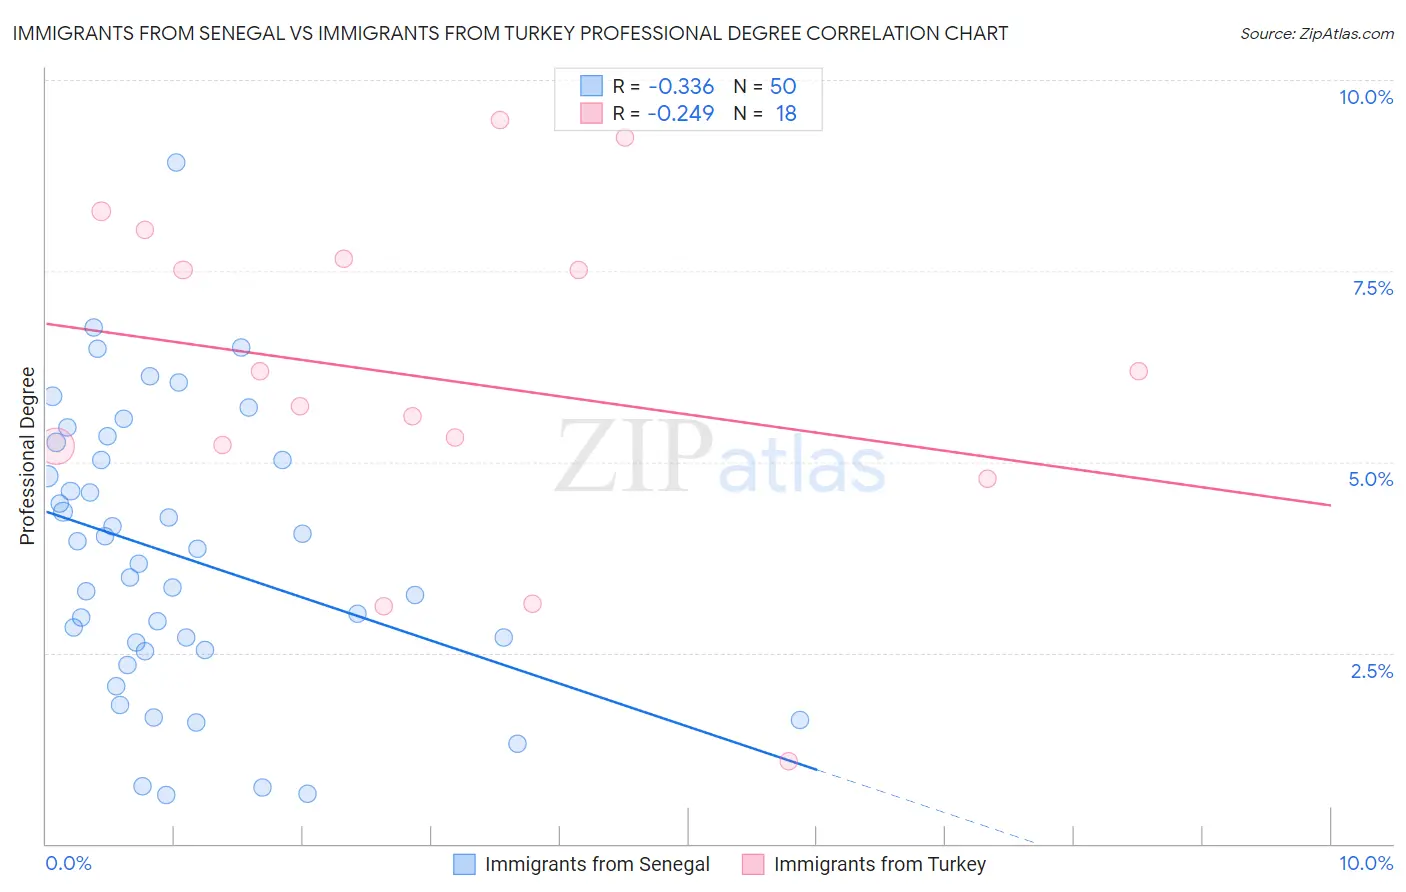
Immigrants from Senegal vs Immigrants from Turkey Professional Degree Correlation Chart
The statistical analysis conducted on geographies consisting of 90,094,809 people shows a mild negative correlation between the proportion of Immigrants from Senegal and percentage of population with at least professional degree education in the United States with a correlation coefficient (R) of -0.336 and weighted average of 4.5%. Similarly, the statistical analysis conducted on geographies consisting of 222,933,233 people shows a weak negative correlation between the proportion of Immigrants from Turkey and percentage of population with at least professional degree education in the United States with a correlation coefficient (R) of -0.249 and weighted average of 6.2%, a difference of 36.2%.
Professional Degree Correlation Summary
| Measurement | Immigrants from Senegal | Immigrants from Turkey |
| Minimum | 0.65% | 1.1% |
| Maximum | 8.9% | 9.5% |
| Range | 8.3% | 8.4% |
| Mean | 3.8% | 6.1% |
| Median | 3.8% | 6.0% |
| Interquartile 25% (IQ1) | 2.5% | 5.2% |
| Interquartile 75% (IQ3) | 5.0% | 7.7% |
| Interquartile Range (IQR) | 2.5% | 2.5% |
| Standard Deviation (Sample) | 1.8% | 2.2% |
| Standard Deviation (Population) | 1.8% | 2.2% |
Similar Demographics by Professional Degree
Demographics Similar to Immigrants from Senegal by Professional Degree
In terms of professional degree, the demographic groups most similar to Immigrants from Senegal are Vietnamese (4.5%, a difference of 0.060%), Assyrian/Chaldean/Syriac (4.5%, a difference of 0.10%), Immigrants from Armenia (4.5%, a difference of 0.14%), Iraqi (4.5%, a difference of 0.30%), and Swedish (4.5%, a difference of 0.32%).
| Demographics | Rating | Rank | Professional Degree |
| Immigrants | Uruguay | 72.5 /100 | #153 | Good 4.6% |
| Scottish | 71.8 /100 | #154 | Good 4.6% |
| Slavs | 70.8 /100 | #155 | Good 4.5% |
| Swedes | 69.9 /100 | #156 | Good 4.5% |
| Iraqis | 69.8 /100 | #157 | Good 4.5% |
| Immigrants | Armenia | 68.8 /100 | #158 | Good 4.5% |
| Vietnamese | 68.4 /100 | #159 | Good 4.5% |
| Immigrants | Senegal | 68.0 /100 | #160 | Good 4.5% |
| Assyrians/Chaldeans/Syriacs | 67.4 /100 | #161 | Good 4.5% |
| Peruvians | 65.2 /100 | #162 | Good 4.5% |
| Sierra Leoneans | 64.3 /100 | #163 | Good 4.5% |
| Swiss | 61.0 /100 | #164 | Good 4.5% |
| Costa Ricans | 59.9 /100 | #165 | Average 4.5% |
| Immigrants | Colombia | 59.4 /100 | #166 | Average 4.5% |
| Immigrants | Afghanistan | 59.2 /100 | #167 | Average 4.5% |
Demographics Similar to Immigrants from Turkey by Professional Degree
In terms of professional degree, the demographic groups most similar to Immigrants from Turkey are Immigrants from Sri Lanka (6.2%, a difference of 0.0%), Immigrants from India (6.2%, a difference of 0.12%), Thai (6.1%, a difference of 0.35%), Burmese (6.1%, a difference of 0.39%), and Mongolian (6.1%, a difference of 0.52%).
| Demographics | Rating | Rank | Professional Degree |
| Russians | 100.0 /100 | #23 | Exceptional 6.3% |
| Immigrants | Spain | 100.0 /100 | #24 | Exceptional 6.3% |
| Immigrants | Ireland | 100.0 /100 | #25 | Exceptional 6.3% |
| Latvians | 100.0 /100 | #26 | Exceptional 6.2% |
| Immigrants | Northern Europe | 100.0 /100 | #27 | Exceptional 6.2% |
| Turks | 100.0 /100 | #28 | Exceptional 6.2% |
| Immigrants | Sri Lanka | 100.0 /100 | #29 | Exceptional 6.2% |
| Immigrants | Turkey | 100.0 /100 | #30 | Exceptional 6.2% |
| Immigrants | India | 100.0 /100 | #31 | Exceptional 6.2% |
| Thais | 100.0 /100 | #32 | Exceptional 6.1% |
| Burmese | 100.0 /100 | #33 | Exceptional 6.1% |
| Mongolians | 100.0 /100 | #34 | Exceptional 6.1% |
| Immigrants | Korea | 100.0 /100 | #35 | Exceptional 6.1% |
| Immigrants | Russia | 100.0 /100 | #36 | Exceptional 6.0% |
| Immigrants | Austria | 100.0 /100 | #37 | Exceptional 6.0% |