Immigrants from Senegal vs Native/Alaskan Female Poverty Among 25-34 Year Olds
COMPARE
Immigrants from Senegal
Native/Alaskan
Female Poverty Among 25-34 Year Olds
Female Poverty Among 25-34 Year Olds Comparison
Immigrants from Senegal
Natives/Alaskans
15.6%
FEMALE POVERTY AMONG 25-34 YEAR OLDS
0.1/ 100
METRIC RATING
268th/ 347
METRIC RANK
20.3%
FEMALE POVERTY AMONG 25-34 YEAR OLDS
0.0/ 100
METRIC RATING
335th/ 347
METRIC RANK
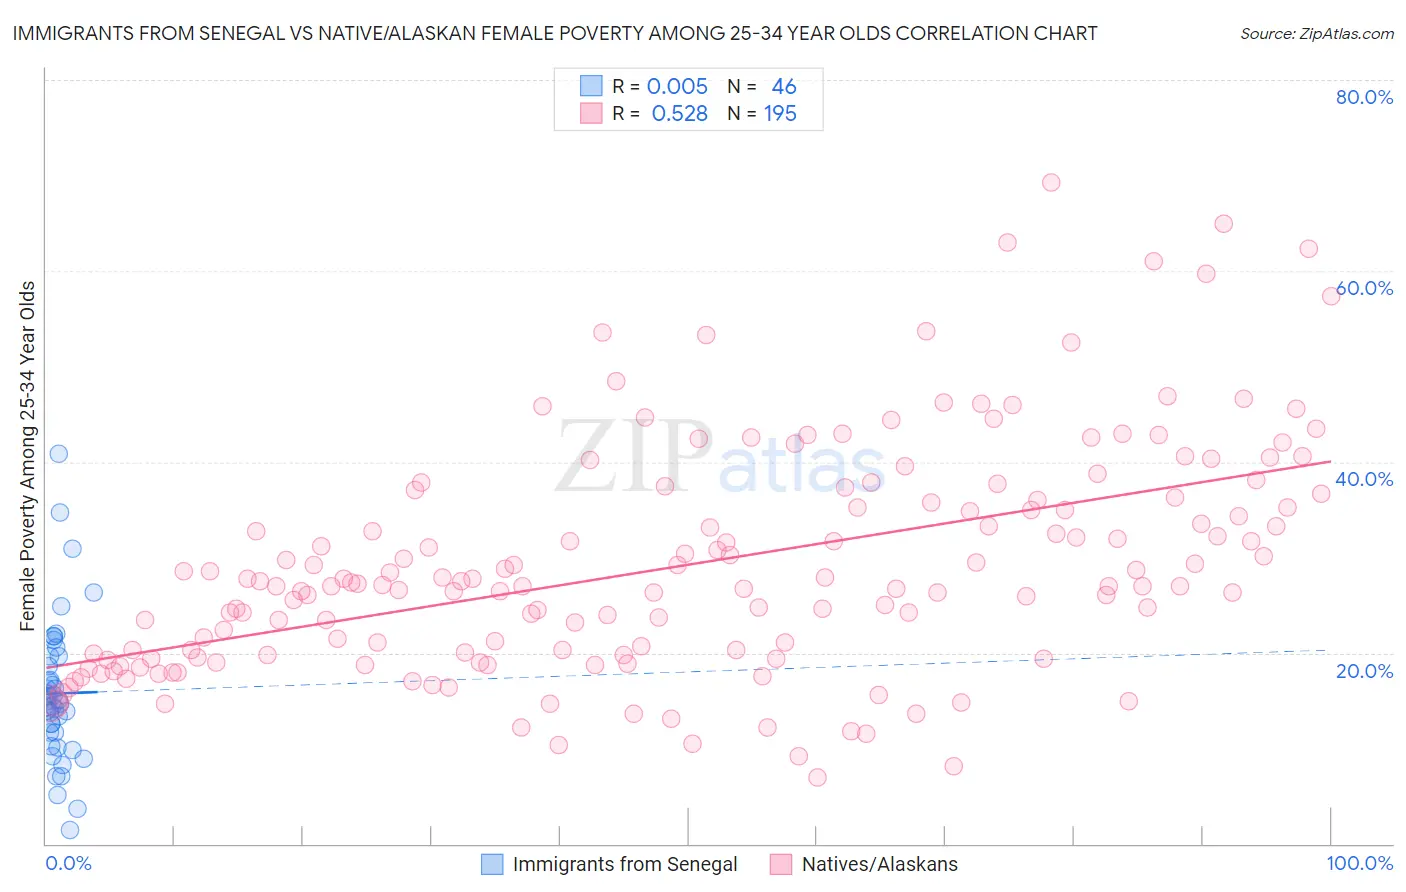
Immigrants from Senegal vs Native/Alaskan Female Poverty Among 25-34 Year Olds Correlation Chart
The statistical analysis conducted on geographies consisting of 89,842,598 people shows no correlation between the proportion of Immigrants from Senegal and poverty level among females between the ages 25 and 34 in the United States with a correlation coefficient (R) of 0.005 and weighted average of 15.6%. Similarly, the statistical analysis conducted on geographies consisting of 501,642,469 people shows a substantial positive correlation between the proportion of Natives/Alaskans and poverty level among females between the ages 25 and 34 in the United States with a correlation coefficient (R) of 0.528 and weighted average of 20.3%, a difference of 30.5%.
Female Poverty Among 25-34 Year Olds Correlation Summary
| Measurement | Immigrants from Senegal | Native/Alaskan |
| Minimum | 1.4% | 6.9% |
| Maximum | 40.9% | 69.3% |
| Range | 39.5% | 62.4% |
| Mean | 15.8% | 29.2% |
| Median | 14.8% | 27.1% |
| Interquartile 25% (IQ1) | 11.6% | 19.8% |
| Interquartile 75% (IQ3) | 19.6% | 36.0% |
| Interquartile Range (IQR) | 8.0% | 16.2% |
| Standard Deviation (Sample) | 7.5% | 11.9% |
| Standard Deviation (Population) | 7.5% | 11.9% |
Similar Demographics by Female Poverty Among 25-34 Year Olds
Demographics Similar to Immigrants from Senegal by Female Poverty Among 25-34 Year Olds
In terms of female poverty among 25-34 year olds, the demographic groups most similar to Immigrants from Senegal are Subsaharan African (15.6%, a difference of 0.21%), British West Indian (15.6%, a difference of 0.36%), Cree (15.6%, a difference of 0.37%), Central American (15.5%, a difference of 0.42%), and Senegalese (15.6%, a difference of 0.44%).
| Demographics | Rating | Rank | Female Poverty Among 25-34 Year Olds |
| Liberians | 0.2 /100 | #261 | Tragic 15.3% |
| Immigrants | Belize | 0.2 /100 | #262 | Tragic 15.3% |
| Mexican American Indians | 0.2 /100 | #263 | Tragic 15.4% |
| Pennsylvania Germans | 0.1 /100 | #264 | Tragic 15.4% |
| Immigrants | Liberia | 0.1 /100 | #265 | Tragic 15.4% |
| Immigrants | Somalia | 0.1 /100 | #266 | Tragic 15.4% |
| Central Americans | 0.1 /100 | #267 | Tragic 15.5% |
| Immigrants | Senegal | 0.1 /100 | #268 | Tragic 15.6% |
| Sub-Saharan Africans | 0.1 /100 | #269 | Tragic 15.6% |
| British West Indians | 0.1 /100 | #270 | Tragic 15.6% |
| Cree | 0.1 /100 | #271 | Tragic 15.6% |
| Senegalese | 0.1 /100 | #272 | Tragic 15.6% |
| Immigrants | Nonimmigrants | 0.1 /100 | #273 | Tragic 15.6% |
| Immigrants | Caribbean | 0.0 /100 | #274 | Tragic 15.7% |
| Immigrants | Azores | 0.0 /100 | #275 | Tragic 15.8% |
Demographics Similar to Natives/Alaskans by Female Poverty Among 25-34 Year Olds
In terms of female poverty among 25-34 year olds, the demographic groups most similar to Natives/Alaskans are Apache (20.1%, a difference of 1.1%), Cajun (19.9%, a difference of 1.8%), Immigrants from Yemen (19.8%, a difference of 2.6%), Kiowa (19.7%, a difference of 3.2%), and Paiute (19.6%, a difference of 3.6%).
| Demographics | Rating | Rank | Female Poverty Among 25-34 Year Olds |
| Alaskan Athabascans | 0.0 /100 | #328 | Tragic 19.1% |
| Creek | 0.0 /100 | #329 | Tragic 19.2% |
| Paiute | 0.0 /100 | #330 | Tragic 19.6% |
| Kiowa | 0.0 /100 | #331 | Tragic 19.7% |
| Immigrants | Yemen | 0.0 /100 | #332 | Tragic 19.8% |
| Cajuns | 0.0 /100 | #333 | Tragic 19.9% |
| Apache | 0.0 /100 | #334 | Tragic 20.1% |
| Natives/Alaskans | 0.0 /100 | #335 | Tragic 20.3% |
| Pueblo | 0.0 /100 | #336 | Tragic 22.2% |
| Crow | 0.0 /100 | #337 | Tragic 22.7% |
| Houma | 0.0 /100 | #338 | Tragic 22.7% |
| Yuman | 0.0 /100 | #339 | Tragic 22.9% |
| Sioux | 0.0 /100 | #340 | Tragic 23.0% |
| Navajo | 0.0 /100 | #341 | Tragic 23.3% |
| Hopi | 0.0 /100 | #342 | Tragic 23.7% |