Comanche vs Immigrants from Turkey Female Poverty Among 25-34 Year Olds

COMPARE

Comanche
Race
Ancestry
AfghanAfricanAlaska NativeAlaskan AthabascanAlbanianAleutAlsatianAmericanApacheArabArapahoArgentineanArmenianAssyrian/Chaldean/SyriacAustralianAustrianBahamianBangladeshiBarbadianBasqueBelgianBelizeanBermudanBhutaneseBlackfeetBolivianBrazilianBritishBritish West IndianBulgarianBurmeseCajunCambodianCanadianCape VerdeanCarpatho RusynCelticCentral AmericanCentral American IndianCherokeeCheyenneChickasawChileanChineseChippewaChoctawColombianColvilleComancheCosta RicanCreeCreekCroatianCrowCubanCypriotCzechCzechoslovakianDanishDelawareDominicanDutchDutch West IndianEastern EuropeanEcuadorianEgyptianEnglishEstonianEthiopianEuropeanFijianFilipinoFinnishFrenchFrench American IndianFrench CanadianGermanGerman RussianGhanaianGreekGuamanian/ChamorroGuatemalanGuyaneseHaitianHmongHonduranHopiHoumaHungarianIcelanderIndian (Asian)IndonesianInupiatIranianIraqiIrishIroquoisIsraeliItalianJamaicanJapaneseJordanianKenyanKiowaKoreanLaotianLatvianLebaneseLiberianLithuanianLumbeeLuxembourgerMacedonianMalaysianMalteseMarshalleseMenomineeMexicanMexican American IndianMongolianMoroccanNative HawaiianNavajoNepaleseNew ZealanderNicaraguanNigerianNorthern EuropeanNorwegianOkinawanOsageOttawaPaiutePakistaniPalestinianPanamanianParaguayanPennsylvania GermanPeruvianPimaPolishPortuguesePotawatomiPuebloPuerto RicanPuget Sound SalishRomanianRussianSalvadoranSamoanScandinavianScotch-IrishScottishSeminoleSenegaleseSerbianShoshoneSierra LeoneanSiouxSlavicSlovakSloveneSomaliSouth AfricanSouth AmericanSouth American IndianSoviet UnionSpaniardSpanishSpanish AmericanSpanish American IndianSri LankanSubsaharan AfricanSudaneseSwedishSwissSyrianTaiwaneseThaiTlingit-HaidaTohono O'OdhamTonganTrinidadian and TobagonianTsimshianTurkishU.S. Virgin IslanderUgandanUkrainianUruguayanUteVenezuelanVietnameseWelshWest IndianYakamaYaquiYugoslavianYumanYup'ikZimbabwean
Immigration
NonimmigrantsImmigrantsAfghanistanAfricaAlbaniaArgentinaArmeniaAsiaAustraliaAustriaBahamasBangladeshBarbadosBelarusBelgiumBelizeBoliviaBosnia and HerzegovinaBrazilBulgariaBurma/MyanmarCabo VerdeCambodiaCameroonCanadaCaribbeanCentral AmericaChileChinaColombiaCongoCosta RicaCroatiaCubaCzechoslovakiaDenmarkDominicaDominican RepublicEastern AfricaEastern AsiaEastern EuropeEcuadorEgyptEl SalvadorEnglandEritreaEthiopiaEuropeFijiFranceGermanyGhanaGreeceGrenadaGuatemalaGuyanaHaitiHondurasHong KongHungaryIndiaIndonesiaIranIraqIrelandIsraelItalyJamaicaJapanJordanKazakhstanKenyaKoreaKuwaitLaosLatin AmericaLatviaLebanonLiberiaLithuaniaMalaysiaMexicoMicronesiaMiddle AfricaMoldovaMoroccoNepalNetherlandsNicaraguaNigeriaNorth AmericaNorth MacedoniaNorthern AfricaNorthern EuropeNorwayOceaniaPakistanPanamaPeruPhilippinesPolandPortugalRomaniaRussiaSaudi ArabiaScotlandSenegalSerbiaSierra LeoneSingaporeSomaliaSouth AfricaSouth AmericaSouth Central AsiaSouth Eastern AsiaSouthern EuropeSpainSri LankaSt. Vincent and the GrenadinesSudanSwedenSwitzerlandSyriaTaiwanThailandTrinidad and TobagoUgandaUkraineUruguayUzbekistanVenezuelaVietnamWest IndiesWestern AfricaWestern AsiaWestern EuropeYemenZaireZimbabweAzores
Immigrants from Turkey
Race
Ancestry
AfghanAfricanAlaska NativeAlaskan AthabascanAlbanianAleutAlsatianAmericanApacheArabArapahoArgentineanArmenianAssyrian/Chaldean/SyriacAustralianAustrianBahamianBangladeshiBarbadianBasqueBelgianBelizeanBermudanBhutaneseBlackfeetBolivianBrazilianBritishBritish West IndianBulgarianBurmeseCajunCambodianCanadianCape VerdeanCarpatho RusynCelticCentral AmericanCentral American IndianCherokeeCheyenneChickasawChileanChineseChippewaChoctawColombianColvilleCosta RicanCreeCreekCroatianCrowCubanCypriotCzechCzechoslovakianDanishDelawareDominicanDutchDutch West IndianEastern EuropeanEcuadorianEgyptianEnglishEstonianEthiopianEuropeanFijianFilipinoFinnishFrenchFrench American IndianFrench CanadianGermanGerman RussianGhanaianGreekGuamanian/ChamorroGuatemalanGuyaneseHaitianHmongHonduranHopiHoumaHungarianIcelanderIndian (Asian)IndonesianInupiatIranianIraqiIrishIroquoisIsraeliItalianJamaicanJapaneseJordanianKenyanKiowaKoreanLaotianLatvianLebaneseLiberianLithuanianLumbeeLuxembourgerMacedonianMalaysianMalteseMarshalleseMenomineeMexicanMexican American IndianMongolianMoroccanNative HawaiianNavajoNepaleseNew ZealanderNicaraguanNigerianNorthern EuropeanNorwegianOkinawanOsageOttawaPaiutePakistaniPalestinianPanamanianParaguayanPennsylvania GermanPeruvianPimaPolishPortuguesePotawatomiPuebloPuerto RicanPuget Sound SalishRomanianRussianSalvadoranSamoanScandinavianScotch-IrishScottishSeminoleSenegaleseSerbianShoshoneSierra LeoneanSiouxSlavicSlovakSloveneSomaliSouth AfricanSouth AmericanSouth American IndianSoviet UnionSpaniardSpanishSpanish AmericanSpanish American IndianSri LankanSubsaharan AfricanSudaneseSwedishSwissSyrianTaiwaneseThaiTlingit-HaidaTohono O'OdhamTonganTrinidadian and TobagonianTsimshianTurkishU.S. Virgin IslanderUgandanUkrainianUruguayanUteVenezuelanVietnameseWelshWest IndianYakamaYaquiYugoslavianYumanYup'ikZimbabwean
Immigration
NonimmigrantsImmigrantsAfghanistanAfricaAlbaniaArgentinaArmeniaAsiaAustraliaAustriaBahamasBangladeshBarbadosBelarusBelgiumBelizeBoliviaBosnia and HerzegovinaBrazilBulgariaBurma/MyanmarCabo VerdeCambodiaCameroonCanadaCaribbeanCentral AmericaChileChinaColombiaCongoCosta RicaCroatiaCubaCzechoslovakiaDenmarkDominicaDominican RepublicEastern AfricaEastern AsiaEastern EuropeEcuadorEgyptEl SalvadorEnglandEritreaEthiopiaEuropeFijiFranceGermanyGhanaGreeceGrenadaGuatemalaGuyanaHaitiHondurasHong KongHungaryIndiaIndonesiaIranIraqIrelandIsraelItalyJamaicaJapanJordanKazakhstanKenyaKoreaKuwaitLaosLatin AmericaLatviaLebanonLiberiaLithuaniaMalaysiaMexicoMicronesiaMiddle AfricaMoldovaMoroccoNepalNetherlandsNicaraguaNigeriaNorth AmericaNorth MacedoniaNorthern AfricaNorthern EuropeNorwayOceaniaPakistanPanamaPeruPhilippinesPolandPortugalRomaniaRussiaSaudi ArabiaScotlandSenegalSerbiaSierra LeoneSingaporeSomaliaSouth AfricaSouth AmericaSouth Central AsiaSouth Eastern AsiaSouthern EuropeSpainSri LankaSt. Vincent and the GrenadinesSudanSwedenSwitzerlandSyriaTaiwanThailandTrinidad and TobagoTurkeyUgandaUkraineUruguayUzbekistanVenezuelaVietnamWest IndiesWestern AfricaWestern AsiaWestern EuropeYemenZaireZimbabweAzores
Female Poverty Among 25-34 Year Olds
Income
Poverty
Unemployment
Labor Participation
Family Structure
Vehicle Availability
Education Level
Disability

Female Poverty Among 25-34 Year Olds Comparison

Comanche

Immigrants from Turkey

Tragic
Exceptional
16.5%
FEMALE POVERTY AMONG 25-34 YEAR OLDS
0.0/ 100
METRIC RATING
291st/ 347
METRIC RANK
11.9%
FEMALE POVERTY AMONG 25-34 YEAR OLDS
99.7/ 100
METRIC RATING
42nd/ 347
METRIC RANK

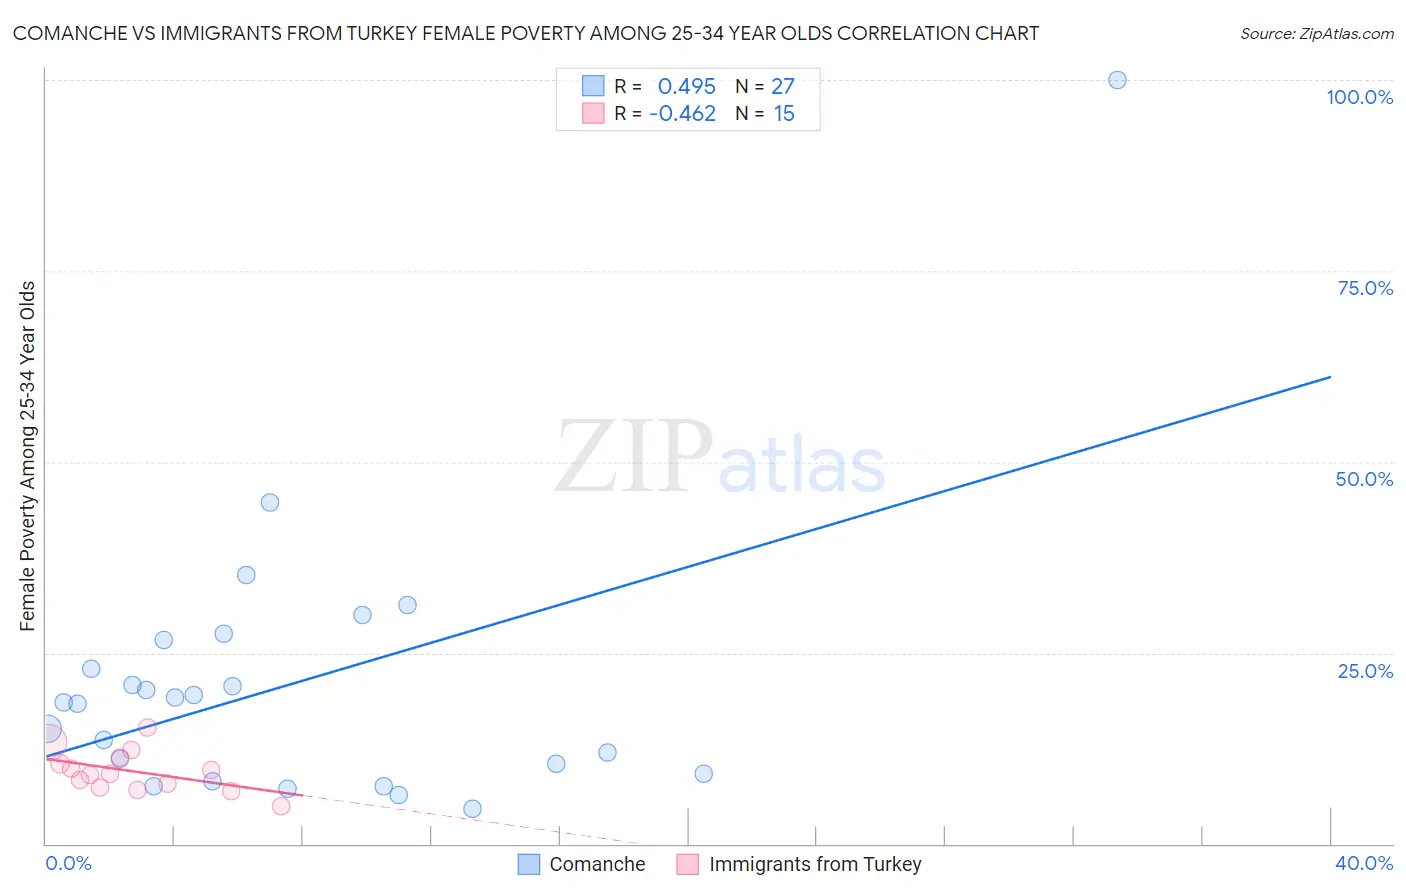
Comanche vs Immigrants from Turkey Female Poverty Among 25-34 Year Olds Correlation Chart

The statistical analysis conducted on geographies consisting of 109,487,317 people shows a moderate positive correlation between the proportion of Comanche and poverty level among females between the ages 25 and 34 in the United States with a correlation coefficient (R) of 0.495 and weighted average of 16.5%. Similarly, the statistical analysis conducted on geographies consisting of 220,548,075 people shows a moderate negative correlation between the proportion of Immigrants from Turkey and poverty level among females between the ages 25 and 34 in the United States with a correlation coefficient (R) of -0.462 and weighted average of 11.9%, a difference of 38.6%.
Comanche vs Immigrants from Turkey Female Poverty Among 25-34 Year Olds

Female Poverty Among 25-34 Year Olds Correlation Summary

MeasurementComancheImmigrants from Turkey
Minimum4.5%4.9%
Maximum100.0%15.3%
Range95.5%10.3%
Mean21.0%9.5%
Median18.5%9.1%
Interquartile 25% (IQ1)9.1%7.3%
Interquartile 75% (IQ3)26.7%11.3%
Interquartile Range (IQR)17.6%4.0%
Standard Deviation (Sample)18.6%2.7%
Standard Deviation (Population)18.3%2.6%

Similar Demographics by Female Poverty Among 25-34 Year Olds

Demographics Similar to Comanche by Female Poverty Among 25-34 Year Olds

In terms of female poverty among 25-34 year olds, the demographic groups most similar to Comanche are Immigrants from Dominica (16.5%, a difference of 0.010%), Indonesian (16.4%, a difference of 0.28%), Potawatomi (16.5%, a difference of 0.28%), Osage (16.4%, a difference of 0.44%), and Guatemalan (16.4%, a difference of 0.50%).
DemographicsRating | RankFemale Poverty Among 25-34 Year Olds
Shoshone
0.0
/100
|
#284
Tragic
16.2%
Immigrants | Bahamas
0.0
/100
|
#285
Tragic
16.3%
Cape Verdeans
0.0
/100
|
#286
Tragic
16.3%
Americans
0.0
/100
|
#287
Tragic
16.4%
Guatemalans
0.0
/100
|
#288
Tragic
16.4%
Osage
0.0
/100
|
#289
Tragic
16.4%
Indonesians
0.0
/100
|
#290
Tragic
16.4%
Comanche
0.0
/100
|
#291
Tragic
16.5%
Immigrants | Dominica
0.0
/100
|
#292
Tragic
16.5%
Potawatomi
0.0
/100
|
#293
Tragic
16.5%
Immigrants | Central America
0.0
/100
|
#294
Tragic
16.6%
Mexicans
0.0
/100
|
#295
Tragic
16.6%
Hispanics or Latinos
0.0
/100
|
#296
Tragic
16.6%
Immigrants | Guatemala
0.0
/100
|
#297
Tragic
16.6%
Blackfeet
0.0
/100
|
#298
Tragic
16.7%

Demographics Similar to Immigrants from Turkey by Female Poverty Among 25-34 Year Olds

In terms of female poverty among 25-34 year olds, the demographic groups most similar to Immigrants from Turkey are Egyptian (11.9%, a difference of 0.25%), Immigrants from Australia (11.9%, a difference of 0.26%), Immigrants from Indonesia (11.8%, a difference of 0.30%), Immigrants from Bulgaria (11.8%, a difference of 0.42%), and Macedonian (11.9%, a difference of 0.53%).
DemographicsRating | RankFemale Poverty Among 25-34 Year Olds
Cambodians
99.9
/100
|
#35
Exceptional
11.7%
Immigrants | Sri Lanka
99.8
/100
|
#36
Exceptional
11.8%
Taiwanese
99.8
/100
|
#37
Exceptional
11.8%
Immigrants | North Macedonia
99.8
/100
|
#38
Exceptional
11.8%
Latvians
99.8
/100
|
#39
Exceptional
11.8%
Immigrants | Bulgaria
99.8
/100
|
#40
Exceptional
11.8%
Immigrants | Indonesia
99.8
/100
|
#41
Exceptional
11.8%
Immigrants | Turkey
99.7
/100
|
#42
Exceptional
11.9%
Egyptians
99.7
/100
|
#43
Exceptional
11.9%
Immigrants | Australia
99.7
/100
|
#44
Exceptional
11.9%
Macedonians
99.7
/100
|
#45
Exceptional
11.9%
Immigrants | Serbia
99.7
/100
|
#46
Exceptional
11.9%
Koreans
99.6
/100
|
#47
Exceptional
12.0%
Immigrants | Belarus
99.6
/100
|
#48
Exceptional
12.0%
Immigrants | Egypt
99.6
/100
|
#49
Exceptional
12.0%