Immigrants from Ghana vs Immigrants from Turkey Female Poverty Among 25-34 Year Olds
COMPARE
Immigrants from Ghana
Immigrants from Turkey
Female Poverty Among 25-34 Year Olds
Female Poverty Among 25-34 Year Olds Comparison
Immigrants from Ghana
Immigrants from Turkey
14.7%
FEMALE POVERTY AMONG 25-34 YEAR OLDS
1.4/ 100
METRIC RATING
237th/ 347
METRIC RANK
11.9%
FEMALE POVERTY AMONG 25-34 YEAR OLDS
99.7/ 100
METRIC RATING
42nd/ 347
METRIC RANK
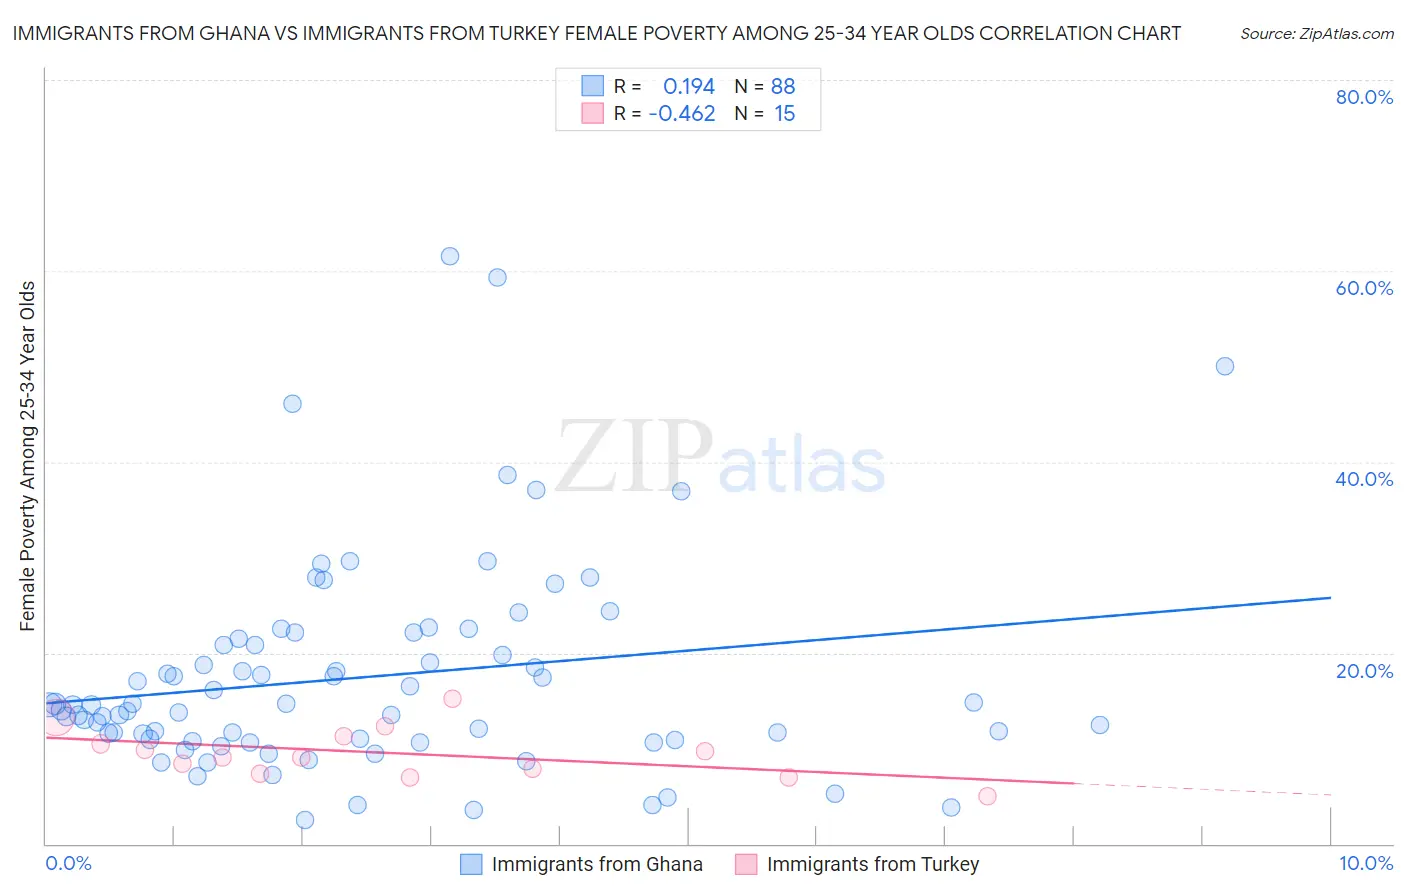
Immigrants from Ghana vs Immigrants from Turkey Female Poverty Among 25-34 Year Olds Correlation Chart
The statistical analysis conducted on geographies consisting of 198,538,106 people shows a poor positive correlation between the proportion of Immigrants from Ghana and poverty level among females between the ages 25 and 34 in the United States with a correlation coefficient (R) of 0.194 and weighted average of 14.7%. Similarly, the statistical analysis conducted on geographies consisting of 220,548,075 people shows a moderate negative correlation between the proportion of Immigrants from Turkey and poverty level among females between the ages 25 and 34 in the United States with a correlation coefficient (R) of -0.462 and weighted average of 11.9%, a difference of 24.0%.
Female Poverty Among 25-34 Year Olds Correlation Summary
| Measurement | Immigrants from Ghana | Immigrants from Turkey |
| Minimum | 2.5% | 4.9% |
| Maximum | 61.5% | 15.3% |
| Range | 59.1% | 10.3% |
| Mean | 17.4% | 9.5% |
| Median | 14.5% | 9.1% |
| Interquartile 25% (IQ1) | 10.9% | 7.3% |
| Interquartile 75% (IQ3) | 21.2% | 11.3% |
| Interquartile Range (IQR) | 10.3% | 4.0% |
| Standard Deviation (Sample) | 11.1% | 2.7% |
| Standard Deviation (Population) | 11.1% | 2.6% |
Similar Demographics by Female Poverty Among 25-34 Year Olds
Demographics Similar to Immigrants from Ghana by Female Poverty Among 25-34 Year Olds
In terms of female poverty among 25-34 year olds, the demographic groups most similar to Immigrants from Ghana are Salvadoran (14.7%, a difference of 0.0%), Immigrants from Jamaica (14.7%, a difference of 0.020%), Alsatian (14.7%, a difference of 0.040%), Malaysian (14.7%, a difference of 0.070%), and Immigrants from Grenada (14.7%, a difference of 0.12%).
| Demographics | Rating | Rank | Female Poverty Among 25-34 Year Olds |
| Spaniards | 2.3 /100 | #230 | Tragic 14.6% |
| Delaware | 2.3 /100 | #231 | Tragic 14.6% |
| Immigrants | Ecuador | 1.9 /100 | #232 | Tragic 14.6% |
| Whites/Caucasians | 1.8 /100 | #233 | Tragic 14.7% |
| Cubans | 1.6 /100 | #234 | Tragic 14.7% |
| Immigrants | Jamaica | 1.4 /100 | #235 | Tragic 14.7% |
| Salvadorans | 1.4 /100 | #236 | Tragic 14.7% |
| Immigrants | Ghana | 1.4 /100 | #237 | Tragic 14.7% |
| Alsatians | 1.4 /100 | #238 | Tragic 14.7% |
| Malaysians | 1.4 /100 | #239 | Tragic 14.7% |
| Immigrants | Grenada | 1.3 /100 | #240 | Tragic 14.7% |
| Scotch-Irish | 1.2 /100 | #241 | Tragic 14.8% |
| Barbadians | 1.2 /100 | #242 | Tragic 14.8% |
| Immigrants | Nicaragua | 1.1 /100 | #243 | Tragic 14.8% |
| Immigrants | Bangladesh | 1.1 /100 | #244 | Tragic 14.8% |
Demographics Similar to Immigrants from Turkey by Female Poverty Among 25-34 Year Olds
In terms of female poverty among 25-34 year olds, the demographic groups most similar to Immigrants from Turkey are Egyptian (11.9%, a difference of 0.25%), Immigrants from Australia (11.9%, a difference of 0.26%), Immigrants from Indonesia (11.8%, a difference of 0.30%), Immigrants from Bulgaria (11.8%, a difference of 0.42%), and Macedonian (11.9%, a difference of 0.53%).
| Demographics | Rating | Rank | Female Poverty Among 25-34 Year Olds |
| Cambodians | 99.9 /100 | #35 | Exceptional 11.7% |
| Immigrants | Sri Lanka | 99.8 /100 | #36 | Exceptional 11.8% |
| Taiwanese | 99.8 /100 | #37 | Exceptional 11.8% |
| Immigrants | North Macedonia | 99.8 /100 | #38 | Exceptional 11.8% |
| Latvians | 99.8 /100 | #39 | Exceptional 11.8% |
| Immigrants | Bulgaria | 99.8 /100 | #40 | Exceptional 11.8% |
| Immigrants | Indonesia | 99.8 /100 | #41 | Exceptional 11.8% |
| Immigrants | Turkey | 99.7 /100 | #42 | Exceptional 11.9% |
| Egyptians | 99.7 /100 | #43 | Exceptional 11.9% |
| Immigrants | Australia | 99.7 /100 | #44 | Exceptional 11.9% |
| Macedonians | 99.7 /100 | #45 | Exceptional 11.9% |
| Immigrants | Serbia | 99.7 /100 | #46 | Exceptional 11.9% |
| Koreans | 99.6 /100 | #47 | Exceptional 12.0% |
| Immigrants | Belarus | 99.6 /100 | #48 | Exceptional 12.0% |
| Immigrants | Egypt | 99.6 /100 | #49 | Exceptional 12.0% |