Immigrants from Scotland vs Arapaho Single Father Poverty
COMPARE
Immigrants from Scotland
Arapaho
Single Father Poverty
Single Father Poverty Comparison
Immigrants from Scotland
Arapaho
16.7%
SINGLE FATHER POVERTY
9.6/ 100
METRIC RATING
215th/ 347
METRIC RANK
24.0%
SINGLE FATHER POVERTY
0.0/ 100
METRIC RATING
338th/ 347
METRIC RANK
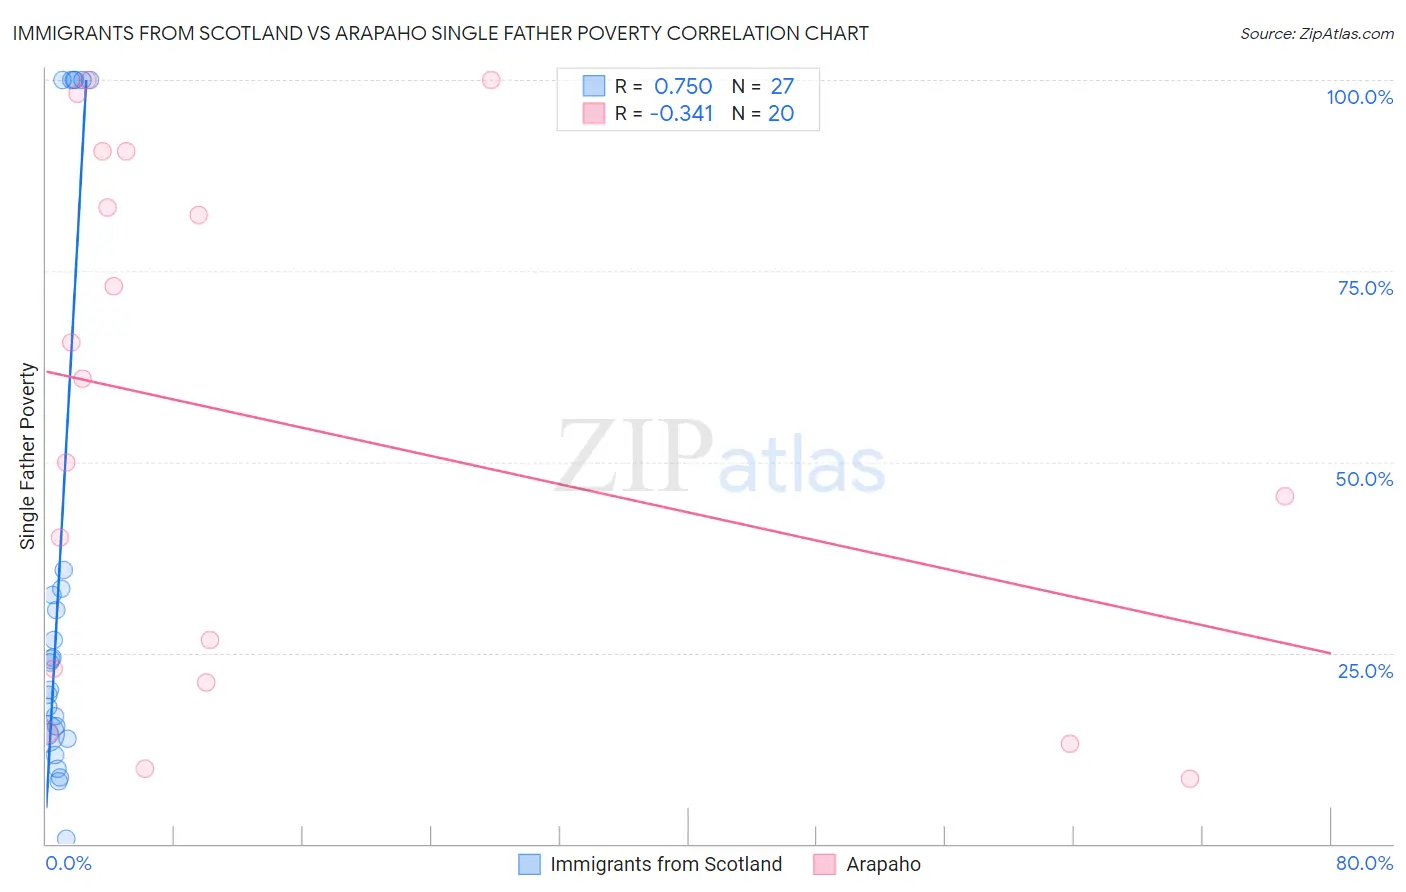
Immigrants from Scotland vs Arapaho Single Father Poverty Correlation Chart
The statistical analysis conducted on geographies consisting of 163,789,782 people shows a strong positive correlation between the proportion of Immigrants from Scotland and poverty level among single fathers in the United States with a correlation coefficient (R) of 0.750 and weighted average of 16.7%. Similarly, the statistical analysis conducted on geographies consisting of 28,107,372 people shows a mild negative correlation between the proportion of Arapaho and poverty level among single fathers in the United States with a correlation coefficient (R) of -0.341 and weighted average of 24.0%, a difference of 43.6%.
Single Father Poverty Correlation Summary
| Measurement | Immigrants from Scotland | Arapaho |
| Minimum | 0.70% | 8.5% |
| Maximum | 100.0% | 100.0% |
| Range | 99.3% | 91.5% |
| Mean | 37.1% | 54.8% |
| Median | 23.7% | 55.4% |
| Interquartile 25% (IQ1) | 14.3% | 22.0% |
| Interquartile 75% (IQ3) | 35.9% | 87.0% |
| Interquartile Range (IQR) | 21.6% | 65.0% |
| Standard Deviation (Sample) | 35.2% | 33.6% |
| Standard Deviation (Population) | 34.6% | 32.7% |
Similar Demographics by Single Father Poverty
Demographics Similar to Immigrants from Scotland by Single Father Poverty
In terms of single father poverty, the demographic groups most similar to Immigrants from Scotland are Immigrants from England (16.7%, a difference of 0.0%), Cheyenne (16.7%, a difference of 0.030%), Spanish (16.7%, a difference of 0.13%), Immigrants from Uganda (16.7%, a difference of 0.13%), and Ghanaian (16.7%, a difference of 0.17%).
| Demographics | Rating | Rank | Single Father Poverty |
| Eastern Europeans | 13.7 /100 | #208 | Poor 16.6% |
| Europeans | 13.2 /100 | #209 | Poor 16.6% |
| Guatemalans | 12.9 /100 | #210 | Poor 16.6% |
| Arabs | 12.8 /100 | #211 | Poor 16.6% |
| Immigrants | Southern Europe | 11.2 /100 | #212 | Poor 16.7% |
| Ghanaians | 11.0 /100 | #213 | Poor 16.7% |
| Spanish | 10.7 /100 | #214 | Poor 16.7% |
| Immigrants | Scotland | 9.6 /100 | #215 | Tragic 16.7% |
| Immigrants | England | 9.5 /100 | #216 | Tragic 16.7% |
| Cheyenne | 9.3 /100 | #217 | Tragic 16.7% |
| Immigrants | Uganda | 8.6 /100 | #218 | Tragic 16.7% |
| Immigrants | Ghana | 8.1 /100 | #219 | Tragic 16.7% |
| Immigrants | Denmark | 8.1 /100 | #220 | Tragic 16.7% |
| Immigrants | Greece | 8.1 /100 | #221 | Tragic 16.7% |
| Immigrants | Spain | 8.0 /100 | #222 | Tragic 16.7% |
Demographics Similar to Arapaho by Single Father Poverty
In terms of single father poverty, the demographic groups most similar to Arapaho are Sioux (23.9%, a difference of 0.41%), Apache (24.2%, a difference of 1.1%), Cajun (23.1%, a difference of 3.9%), Shoshone (22.9%, a difference of 4.6%), and Kiowa (22.5%, a difference of 6.7%).
| Demographics | Rating | Rank | Single Father Poverty |
| Central American Indians | 0.0 /100 | #331 | Tragic 21.7% |
| Tohono O'odham | 0.0 /100 | #332 | Tragic 22.0% |
| Natives/Alaskans | 0.0 /100 | #333 | Tragic 22.4% |
| Kiowa | 0.0 /100 | #334 | Tragic 22.5% |
| Shoshone | 0.0 /100 | #335 | Tragic 22.9% |
| Cajuns | 0.0 /100 | #336 | Tragic 23.1% |
| Sioux | 0.0 /100 | #337 | Tragic 23.9% |
| Arapaho | 0.0 /100 | #338 | Tragic 24.0% |
| Apache | 0.0 /100 | #339 | Tragic 24.2% |
| Houma | 0.0 /100 | #340 | Tragic 26.7% |
| Hopi | 0.0 /100 | #341 | Tragic 27.2% |
| Yuman | 0.0 /100 | #342 | Tragic 28.4% |
| Lumbee | 0.0 /100 | #343 | Tragic 28.5% |
| Navajo | 0.0 /100 | #344 | Tragic 29.2% |
| Crow | 0.0 /100 | #345 | Tragic 30.3% |