Immigrants from Saudi Arabia vs Immigrants from Sweden Female Poverty
COMPARE
Immigrants from Saudi Arabia
Immigrants from Sweden
Female Poverty
Female Poverty Comparison
Immigrants from Saudi Arabia
Immigrants from Sweden
14.8%
FEMALE POVERTY
1.4/ 100
METRIC RATING
233rd/ 347
METRIC RANK
12.3%
FEMALE POVERTY
97.1/ 100
METRIC RATING
81st/ 347
METRIC RANK
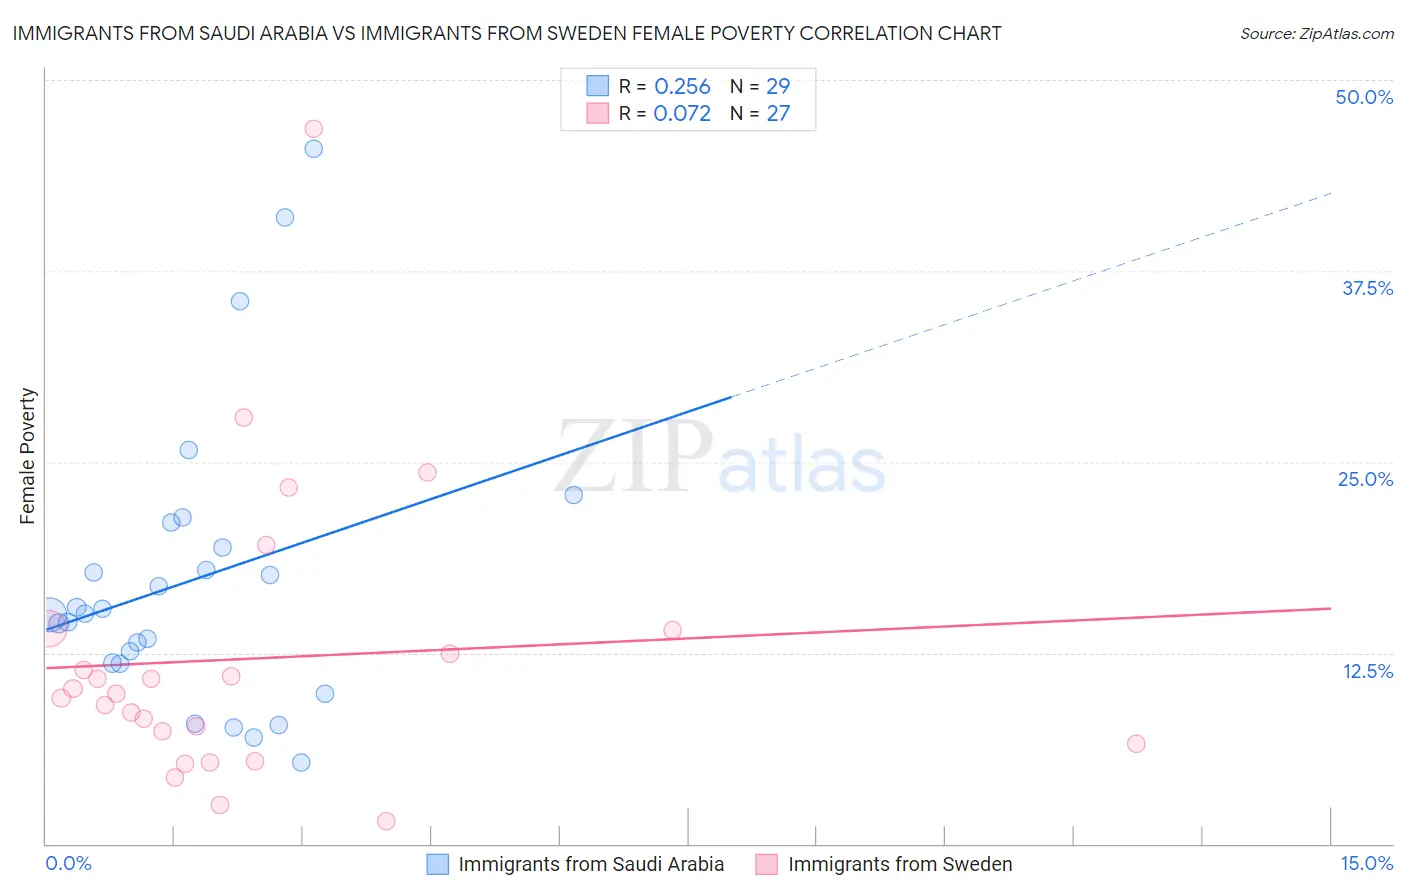
Immigrants from Saudi Arabia vs Immigrants from Sweden Female Poverty Correlation Chart
The statistical analysis conducted on geographies consisting of 164,202,367 people shows a weak positive correlation between the proportion of Immigrants from Saudi Arabia and poverty level among females in the United States with a correlation coefficient (R) of 0.256 and weighted average of 14.8%. Similarly, the statistical analysis conducted on geographies consisting of 164,683,428 people shows a slight positive correlation between the proportion of Immigrants from Sweden and poverty level among females in the United States with a correlation coefficient (R) of 0.072 and weighted average of 12.3%, a difference of 20.4%.
Female Poverty Correlation Summary
| Measurement | Immigrants from Saudi Arabia | Immigrants from Sweden |
| Minimum | 5.3% | 1.5% |
| Maximum | 45.5% | 46.8% |
| Range | 40.2% | 45.4% |
| Mean | 17.3% | 12.1% |
| Median | 15.1% | 9.8% |
| Interquartile 25% (IQ1) | 11.8% | 6.5% |
| Interquartile 75% (IQ3) | 20.2% | 14.0% |
| Interquartile Range (IQR) | 8.4% | 7.5% |
| Standard Deviation (Sample) | 9.6% | 9.5% |
| Standard Deviation (Population) | 9.4% | 9.3% |
Similar Demographics by Female Poverty
Demographics Similar to Immigrants from Saudi Arabia by Female Poverty
In terms of female poverty, the demographic groups most similar to Immigrants from Saudi Arabia are Osage (14.8%, a difference of 0.10%), Nigerian (14.8%, a difference of 0.41%), Alaska Native (14.7%, a difference of 0.51%), Fijian (14.9%, a difference of 0.52%), and Ghanaian (14.7%, a difference of 0.71%).
| Demographics | Rating | Rank | Female Poverty |
| Immigrants | Eritrea | 2.4 /100 | #226 | Tragic 14.6% |
| Immigrants | Nigeria | 2.1 /100 | #227 | Tragic 14.7% |
| German Russians | 2.0 /100 | #228 | Tragic 14.7% |
| Ghanaians | 1.9 /100 | #229 | Tragic 14.7% |
| Alaska Natives | 1.8 /100 | #230 | Tragic 14.7% |
| Nigerians | 1.7 /100 | #231 | Tragic 14.8% |
| Osage | 1.5 /100 | #232 | Tragic 14.8% |
| Immigrants | Saudi Arabia | 1.4 /100 | #233 | Tragic 14.8% |
| Fijians | 1.1 /100 | #234 | Tragic 14.9% |
| Immigrants | Laos | 0.9 /100 | #235 | Tragic 15.0% |
| Cree | 0.7 /100 | #236 | Tragic 15.1% |
| French American Indians | 0.6 /100 | #237 | Tragic 15.1% |
| Immigrants | Armenia | 0.6 /100 | #238 | Tragic 15.1% |
| Immigrants | Middle Africa | 0.5 /100 | #239 | Tragic 15.2% |
| Sudanese | 0.5 /100 | #240 | Tragic 15.2% |
Demographics Similar to Immigrants from Sweden by Female Poverty
In terms of female poverty, the demographic groups most similar to Immigrants from Sweden are Slovak (12.3%, a difference of 0.0%), Jordanian (12.3%, a difference of 0.010%), Immigrants from North America (12.3%, a difference of 0.050%), Egyptian (12.3%, a difference of 0.12%), and Serbian (12.3%, a difference of 0.13%).
| Demographics | Rating | Rank | Female Poverty |
| Immigrants | Canada | 97.5 /100 | #74 | Exceptional 12.3% |
| Europeans | 97.4 /100 | #75 | Exceptional 12.3% |
| Immigrants | Eastern Europe | 97.2 /100 | #76 | Exceptional 12.3% |
| Serbians | 97.2 /100 | #77 | Exceptional 12.3% |
| Egyptians | 97.2 /100 | #78 | Exceptional 12.3% |
| Immigrants | North America | 97.1 /100 | #79 | Exceptional 12.3% |
| Slovaks | 97.1 /100 | #80 | Exceptional 12.3% |
| Immigrants | Sweden | 97.1 /100 | #81 | Exceptional 12.3% |
| Jordanians | 97.1 /100 | #82 | Exceptional 12.3% |
| Immigrants | England | 96.9 /100 | #83 | Exceptional 12.3% |
| Northern Europeans | 96.6 /100 | #84 | Exceptional 12.4% |
| Irish | 96.5 /100 | #85 | Exceptional 12.4% |
| Dutch | 96.5 /100 | #86 | Exceptional 12.4% |
| Okinawans | 96.4 /100 | #87 | Exceptional 12.4% |
| Finns | 96.4 /100 | #88 | Exceptional 12.4% |